2610.03925v1 · First listed 2026-10-06
The differences in the Narrow Line Region of nearby QSOs 1 and QSOs 2: II - Signatures of kinetic feedback
In SDSS fibre spectra of 1,541 type-1 and 688 type-2 QSOs at z=0.4–0.5, broad NLR components are more blueshifted in type 1s, consistent with orientation-dependent visibility of faster ionised outflowing gas, but energetics remain model-sensitive. [1][4]
Evidence
The study measures integrated NLR kinematics within approximately 8–9 kpc-radius apertures for 1,541 QSOs 1 and 688 QSOs 2. It splits the sample at L[O III]=10^9 Lsun into low- and high-luminosity subsamples. Hβ and [O III] λ5007 profiles receive narrow plus broad Gaussian fits; the analysis also uses percentile velocities and W80/W90 widths. Narrow-component median velocities are near zero and dispersions are below about 200 km s−1 for both types, whereas the broad component is more blueshifted in QSOs 1; in the high-luminosity subset its dispersion is about 30% broader than in QSOs 2. The authors interpret the latter differences as outflow signatures, not a direct measurement of intrinsic outflow geometry. [4][5][6]
Earlier work
The paper relates its result to its preceding “Paper I”: higher blueshifts and larger W80/W90 in QSOs 1 are stated to be consistent with that earlier work’s higher NLR excitation and potentially a larger shock contribution. This is a qualitative cross-paper comparison; the supplied extracts do not provide Paper I’s sample, measurements, or bibliographic source, so no quantitative earlier-work comparison can be assessed here. The authors also state that type-2 kinetic powers resemble those of literature AGN at comparable luminosity, while roughly 30% of type 1s are higher, but the underlying comparison datasets are not identified in the supplied text. [9][7]
What changes
Rather than relying only on a broad Gaussian, the work compares broad-component, W80, and W90 velocity prescriptions when estimating ionised mass outflow rates and powers. It frames the type-dependent broad-line kinematics statistically as an orientation effect—type 1 sightlines reaching gas nearer the nucleus—while noting that higher mean [O III] luminosity in type 2s could also indicate an evolutionary obscured phase. These are interpretations of population-level differences, not a demonstrated separation of orientation and evolution for individual QSOs. [1][10]
Limits and open questions
Ionised outflow energetics have mean uncertainties of about 0.25 dex in log Mdotout and 0.5 dex in log Edotout and log Lbol. Changing the adopted outflow speed from vb+2σb to vb+σb lowers inferred Mdotout by roughly a factor of two and Edotout by roughly five. Moreover, the 0.4–0.5 redshift interval produces a narrow luminosity range subject to Malmquist bias; the authors find kinematic scatter/uncertainty larger than the observed luminosity effect. Fibre-integrated spectra cannot spatially locate the disturbed gas within the aperture. [3][10][2][4]
The supplied evidence includes the focal paper’s abstract, conclusion, and selected discussion/uncertainty extracts, plus figure captions, but not the full sample-selection, fitting-validation, or outflow-rate derivations. Figure notes therefore use caption-level information where appropriate.
Key figures
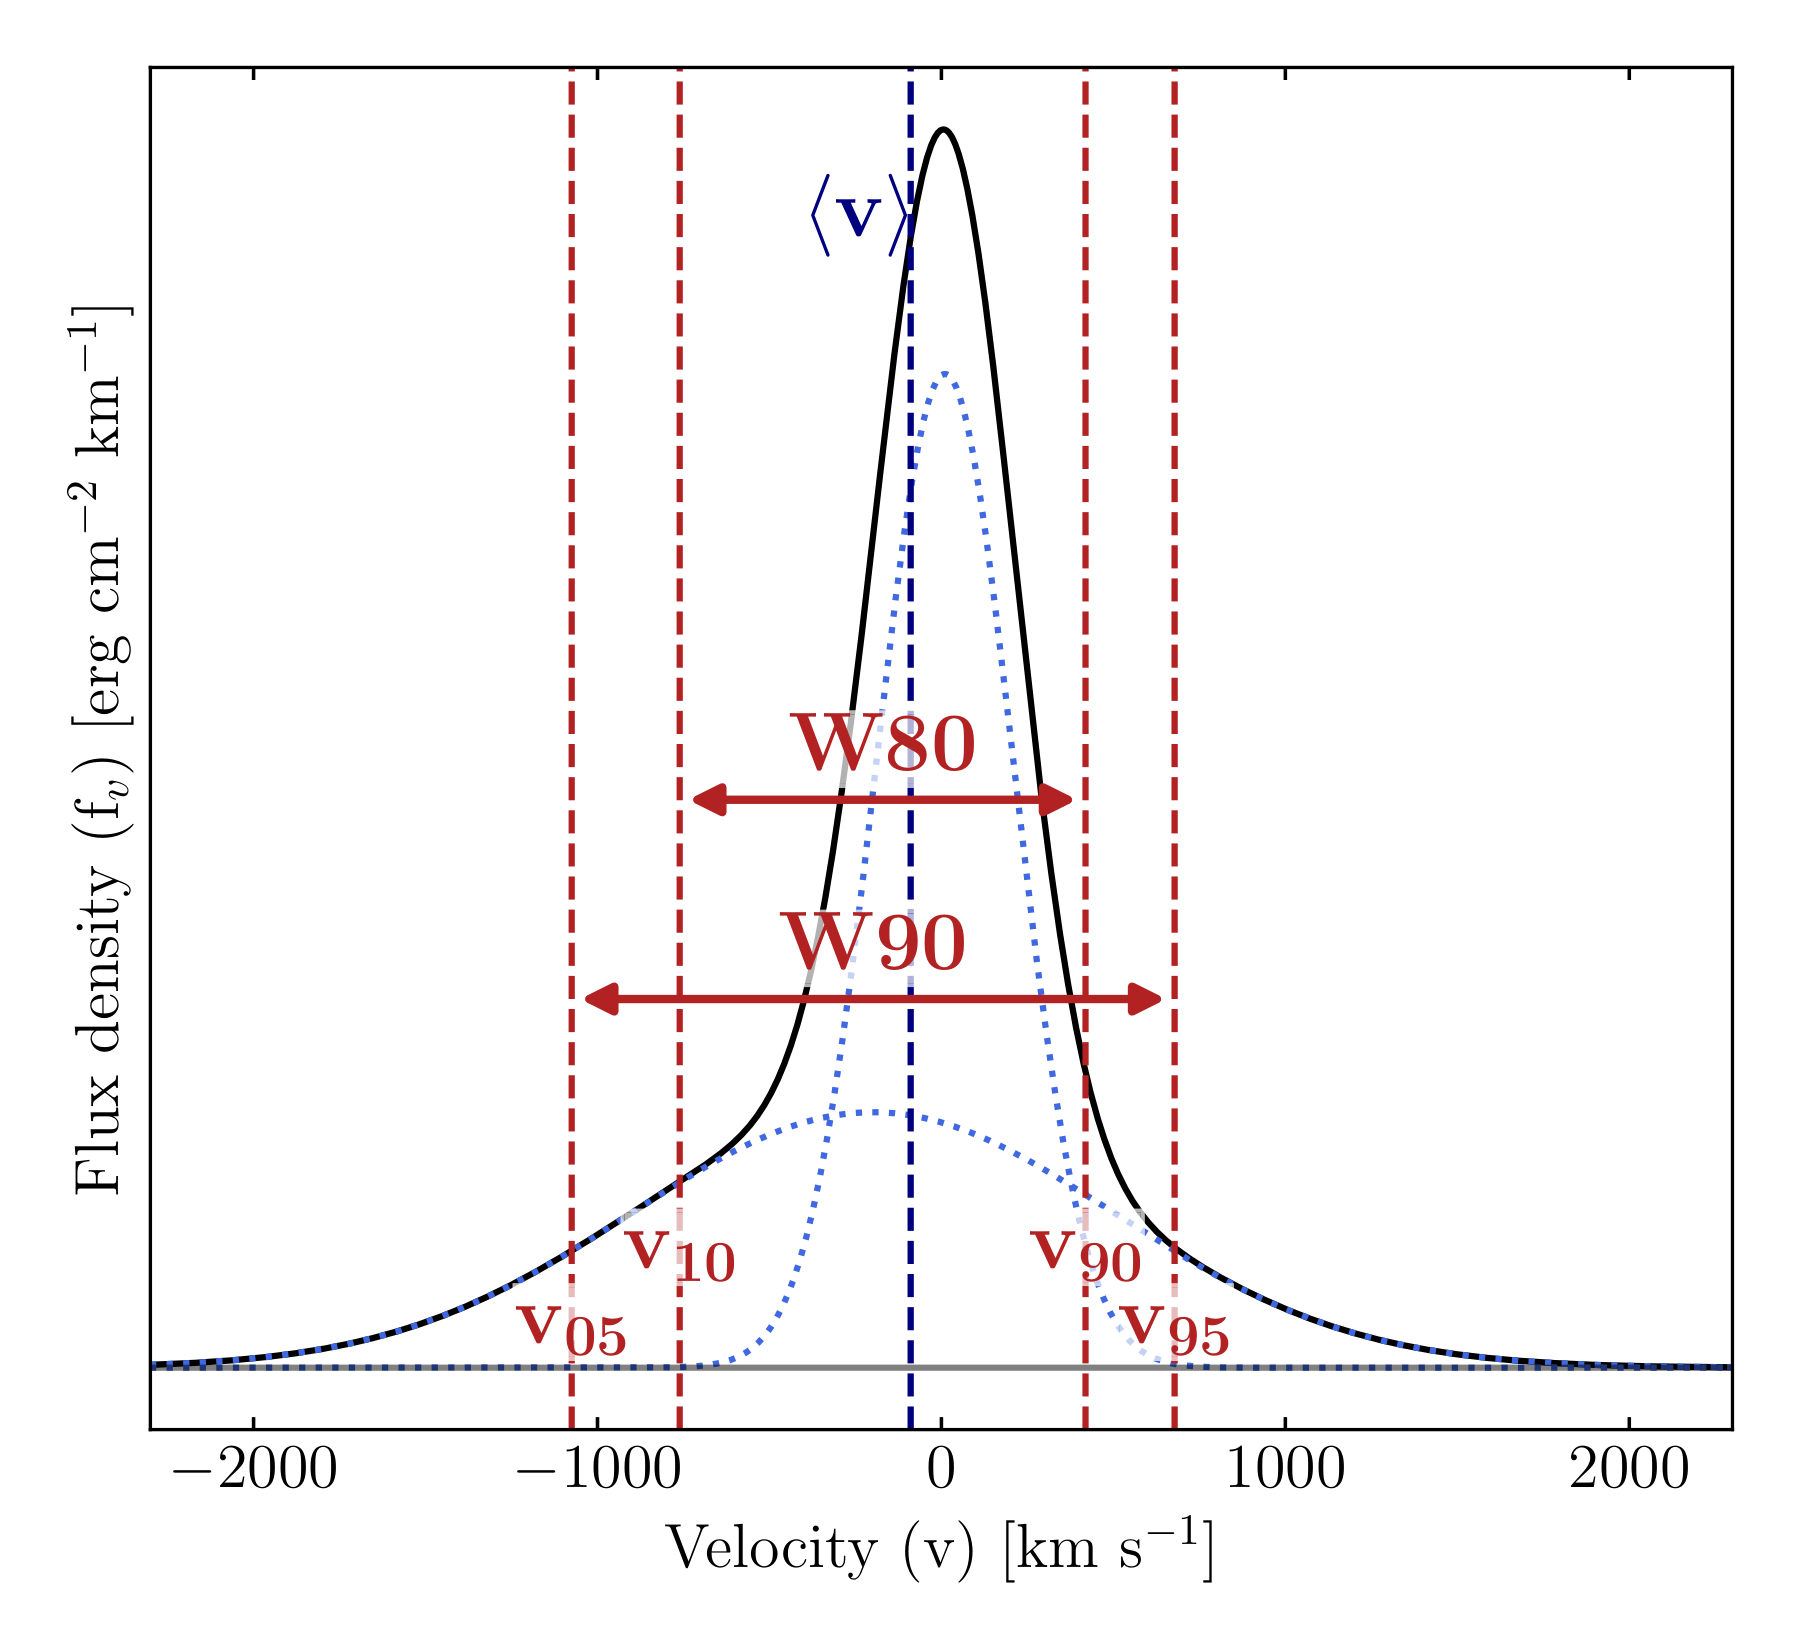
Defines the percentile velocities, W80/W90 widths, and centroid measured from a fitted double-Gaussian line profile; it tests the operational meaning of the kinematic diagnostics rather than an astrophysical difference.
Original caption
Figure 1: Schematic view of v 05 v_{05} , v 10 v_{10} , v 90 v_{90} , v 95 v_{95} , W 80 W80 , W 90 W90 and ⟨ v ⟩ \langle v\rangle overplotted on a double Gaussian emission line fit. The single Gaussian components are shown in dotted light blue curves, and the full profile in black. As vertical red dashed lines, we denote the v 05 v_{05} , v 10 v_{10} , v 90 v_{90} and v 95 v_{95} values, with a red arrow between them showing the profile widths W 80 W80 and W 90 W90 for this example profile. Finally, as a dark blue dashed vertical line we show the centroid velocity ⟨ v ⟩ \langle v\rangle .
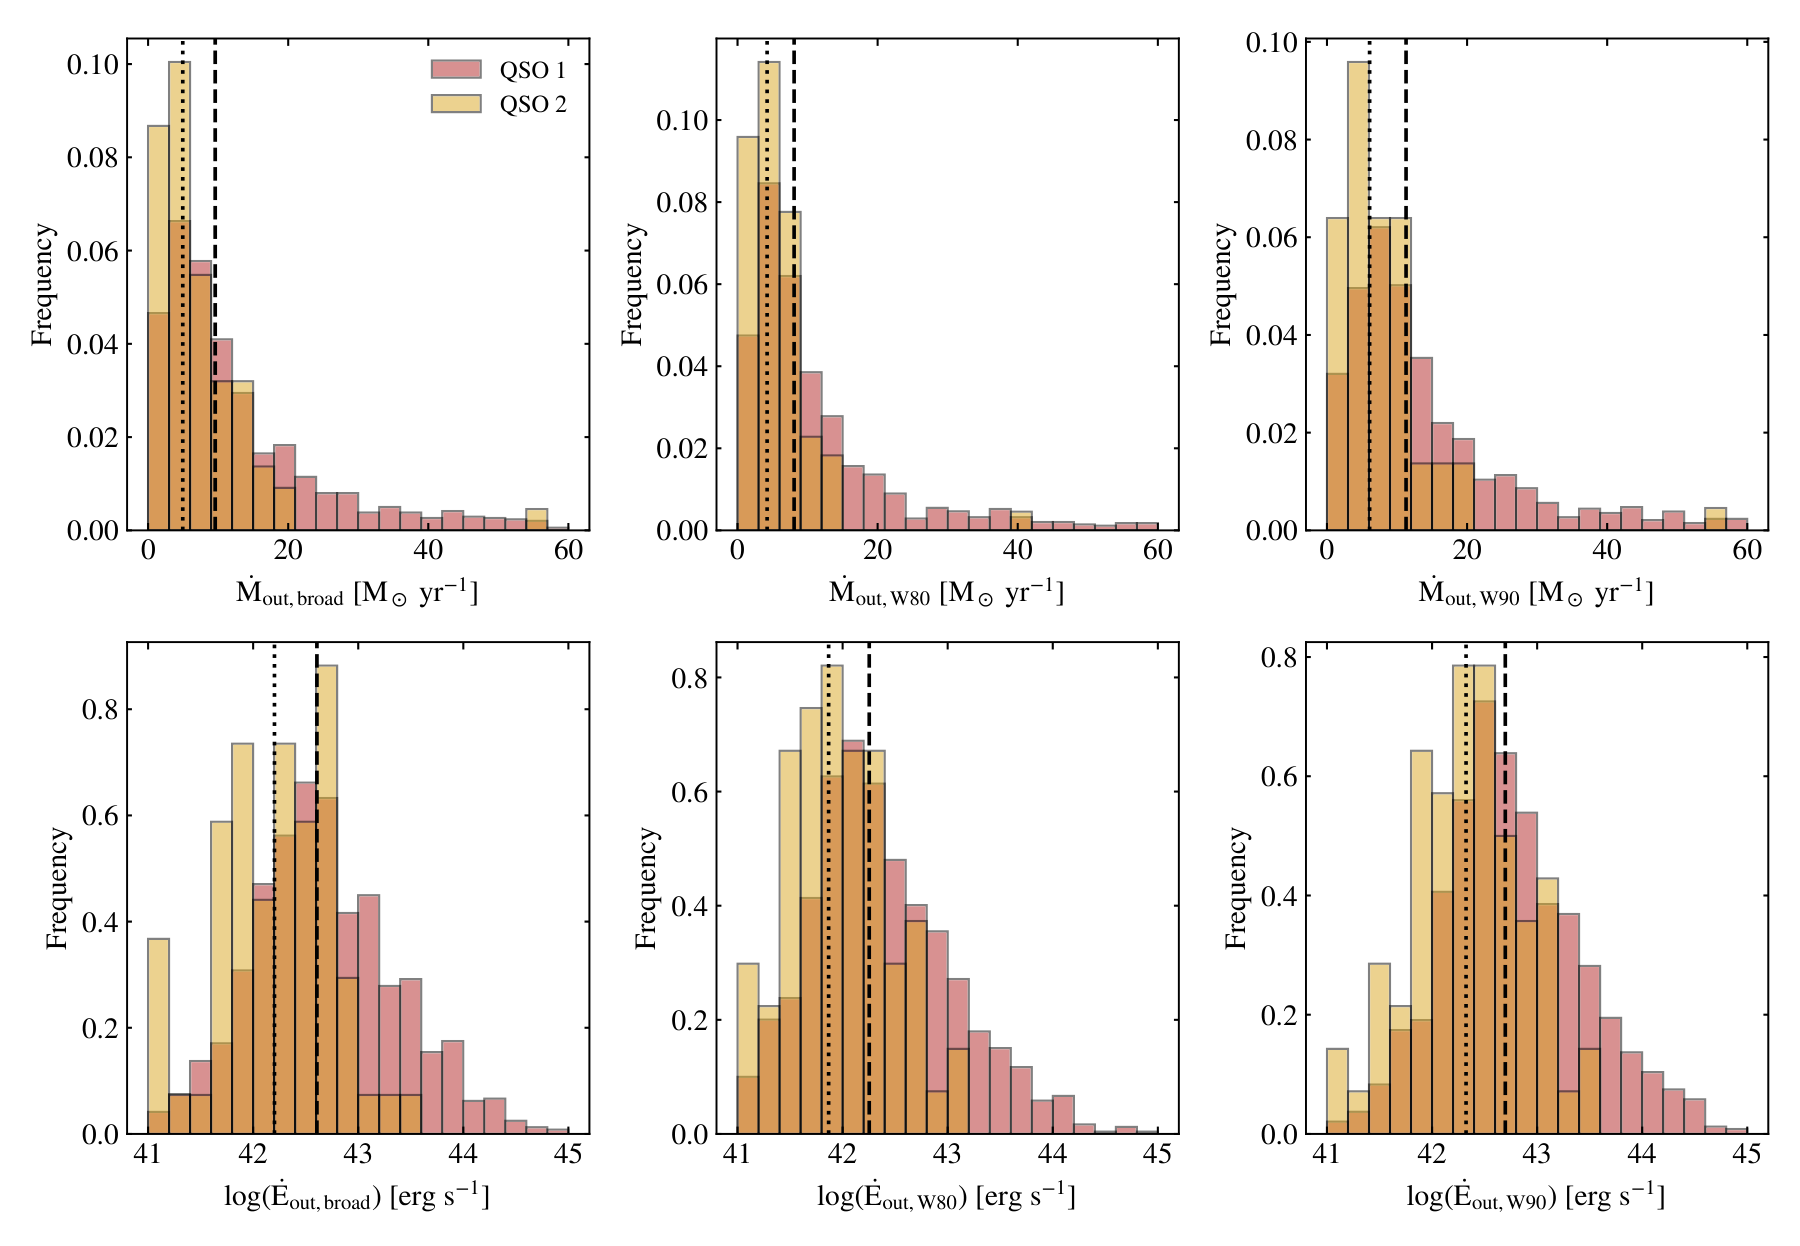
Compares type-1 and type-2 distributions of mass outflow rate and power in the low-luminosity sample under three velocity estimators: broad component, W80, and W90.
Original caption
Figure 5: Normalized distributions of the mass outflow rate (top) and power (bottom) for the QSO 1 and QSO 2 populations, shown as red and yellow, respectively, for the LL sample. The left panels are calculated with the broad component method, the center with the W80 and the right, with the W90 method. The median of each population is shown as black dashed (for type 1) and dotted (for type 2) vertical black lines.
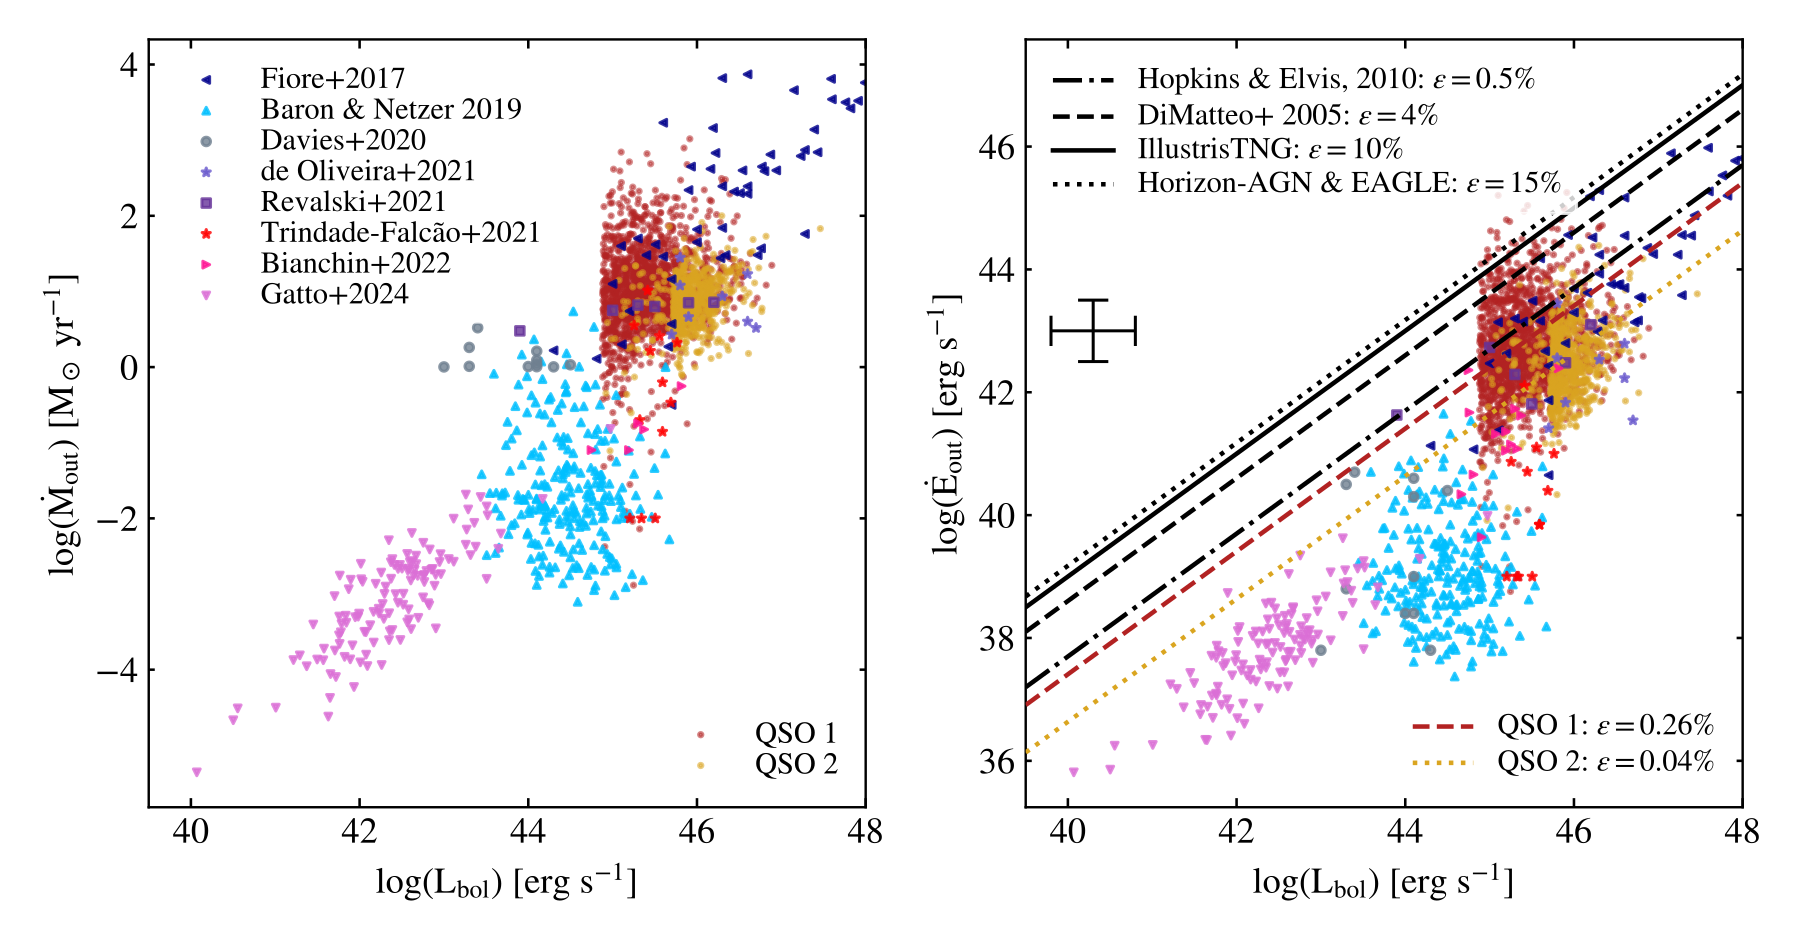
Places broad-component-derived mass outflow rate and kinetic power against bolometric luminosity, with inclination-corrected type-2 broad velocities; it tests type-dependent scaling and comparison with literature/model efficiency lines.
Original caption
Figure 10: M ˙ out \dot{\mathrm{M}}_{\mathrm{out}} –L bol and E ˙ out \dot{\mathrm{E}}_{\mathrm{out}} –L bol planes derived with the broad component method, where the QSOs 2 v b values have been corrected for inclination. For comparison, we add other data points from the literature and also include the accretion efficiency ε \varepsilon lines from models. We include the QSOs 1 and 2 as red and yellow points, respectively, and show also, as dashed lines, the best fit ε \varepsilon lines for them at their respective colours.
Related research
Previous digest
Using SDSS-IV 3-arcsec fiber spectra, this paper compares integrated narrow-line-region kinematics for 1,541 type 1 and 688 type 2 QSOs at 0.4 < z < 0.5, split into luminosity-matched low- and high-luminosity subsamples. The narrow [O III] component is similarly quiescent in both classes, with dispersions below 200 km s^-1, but type 1 QSOs show more blueshifted and broader high-velocity [O III] and high-ionization-line components, including v05, v10, W80, W90, and [Ne V] diagnostics. The result ties the stronger type 1 NLR excitation found in Paper I to orientation, in which a less obscured view reaches gas nearer the nucleus with intrinsically larger velocities, while the higher mean [O III] luminosity of type 2s also leaves room for an obscured-to-blowout evolutionary sequence. Estimated mass-outflow rates and kinetic powers are correspondingly higher for type 1s, although the authors stress that their absolute values remain physically uncertain in unresolved, integrated spectra.
Sources and evidence (26)
- 2610.03925v1: The differences in the Narrow Line Region of nearby QSOs 1 and QSOs 2: II - Signatures of kinetic feedback
We compare the integrated kinematic properties of the Narrow-Line Region (NLR) of ~1500 type 1 and ~700 type 2 QSOs at 0.4 < z < 0.5 using emission-line profiles from SDSS-IV spectra. The NLR [OIII] 5007 and Hbeta emission lines are fitted using a two-component model comprising a narrow (v_n, sigma_n) and a broad component (v_b, sigma_b), while fainter lines are fitted with a single Gaussian component. Both QSO types exhibit similar median narrow-component velocities (v_n ~ 0) and velocity dispersions (sigma < 200 km s^-1), consistent with motion driven by the host galaxy's gravitational potential. However, parameters associated with the broad, high-velocity gas component (v_b, v_05, v_10, v_[NeV], sigma_b, W80 and W90) differ: QSOs 1 display larger blueshifts and broader emission lines than QSOs 2. This suggests that these components trace Active Galactic Nuclei (AGN) outflows, that appear stronger in QSOs 1, leading to higher estimated mass-outflow rates (\dot{M}_out) and kinetic powers (\dot{{E}_out). Rather than offering absolute determinations of \dot{M}_out and \dot{E}_out -- which remain subject to physical uncertainties -- this statistical study supports the higher NLR excitation found for QSOs 1 in Paper I, as an orientation effect: in QSOs 1, we observe gas closer to the AGN core, where velocities and velocity dispersions are intrinsically higher. Nevertheless, the trend of QSOs 2 exhibiting higher average [OIII] luminosities than QSOs 1 suggests an evolutionary contribution, where QSOs 2 represent an early obscured AGN phase followed by a blowout phase that reveals the central core as a QSO 1.
- 2610.03925v1: The differences in the Narrow Line Region of nearby QSOs 1 and QSOs 2: II - Signatures of kinetic feedback
Comparing the results from Tables 1 and 2 , the HL sample has a luminosity ≈ 0.6 \approx 0.6 dex larger than that of the LL sample, with the corresponding median M ˙ out \dot{\mathrm{M}}_{\mathrm{out}} and E ˙ out \dot{\mathrm{E}}_{\mathrm{out}} values also increasing, but only by ≈ \approx 20% in the former and 0.2 dex in the latter. Thus, although there is some effect of luminosity, it is small, that can be attributed, at least in part, to the small range of redshifts of our sample (0.4–0.5) and the Malmquist bias ( Bigot and Triay, 1990 ; Butkevich et al., 2005 ) . This bias makes the sample to be restricted to a narrow range of luminosities. The effect of the scatter/uncertainties in kinematic properties seems to be larger than the effect of the range of luminosities of our sample.
- 2610.03925v1: The differences in the Narrow Line Region of nearby QSOs 1 and QSOs 2: II - Signatures of kinetic feedback
In summary, we estimate that the uncertainties in the parameters discussed above lead to mean uncertainties of ∼ 0.25 \sim 0.25 dex in log M ˙ out \dot{\mathrm{M}}_{\mathrm{out}} and ∼ 0.5 \sim 0.5 dex in log E ˙ out \dot{\mathrm{E}}_{\mathrm{out}} and log L b o l L_{bol} . We have included corresponding error bars in Fig. 10 .
- 2610.03925v1: The differences in the Narrow Line Region of nearby QSOs 1 and QSOs 2: II - Signatures of kinetic feedback
In this work, we have analysed the integrated ionised gas kinematic properties from the Narrow-Line Region (NLR) of a SDSS spectroscopic sample of 1541 QSOs 1 and 688 QSOs 2 at redshifts 0.4 ≤ z ≤ 0.5 0.4\leq z\leq 0.5 , comparing the results for QSOs 1 and 2. These integrated properties – obtained within apertures at the galaxies of ∼ \sim 8–9 kpc radius – comprise velocities, velocity dispersion values, W 80 W80 and W 90 W90 of the strongest NLR emission lines. In the case of H β \beta and [ O iii ] λ \lambda 5007, the profiles were fitted with two components: a narrow and a broad. As done in 28 we subdivide the sample into: a low luminosity (LL) subsample, comprising objects with L [ O iii ] < 10 9 {}_{\mathrm{[\text{O\,{iii}}]}}<10^{9} L ⊙ ; and a high luminosity (HL) one, for objects with L [ O iii ] > 10 9 {}_{\mathrm{[\text{O\,{iii}}]}}>10^{9} L ⊙ .
- 2610.03925v1: The differences in the Narrow Line Region of nearby QSOs 1 and QSOs 2: II - Signatures of kinetic feedback
The kinematics of the narrow component of [ O iii ] and H β \beta – traced by v n and σ n \sigma_{n} – is similar for QSOs 1 and 2, for the LL and HL subsamples, with median v n values close to zero and σ n \sigma_{n} values below ∼ \sim 200 km s -1 . These properties support the interpretation that the narrow component traces gas orbiting in the gravitational potential of its host galaxy;
- 2610.03925v1: The differences in the Narrow Line Region of nearby QSOs 1 and QSOs 2: II - Signatures of kinetic feedback
The kinematics of the broad component – traced by v b and σ b \sigma_{b} – shows instead stronger blueshifts in v b for QSOs 1, with σ b \sigma_{\mathrm{b}} being similar to those of QSOs 2 for the LL sample but ≈ \approx 30% broader for the HL sample. These properties suggest that v b traces outflowing gas, both in QSOs 1 and 2, but probing higher velocities and more disturbed gas in QSOs 1;
- 2610.03925v1: The differences in the Narrow Line Region of nearby QSOs 1 and QSOs 2: II - Signatures of kinetic feedback
When compared to previous results from the literature, the QSOs 2 E ˙ out \dot{\mathrm{E}}_{\mathrm{out}} values are similar to those of other AGN of the same luminosities, while ∼ \sim 30% of the QSOs 1 show higher values; when compared to models, most QSOs 2 show ε \varepsilon values below the minimum 0.05% threshold for effective feedback on the galaxy, while for 30% of the QSOs 1 these values are above this minimum.
- 2610.03925v1: The differences in the Narrow Line Region of nearby QSOs 1 and QSOs 2: II - Signatures of kinetic feedback
The organization of this paper is as follows: in Section 2 we review the sample selection and data. In Section 3, we describe the spectral fitting and analysis, and measurement of kinematic properties. In Sections 4 and 5, we present our results for our Low Luminosity (LL) and High Luminosity (HL) subsamples, respectively. This division in LL and HL subsamples, as done in 28 , resulted from the fact that our data comprises two different QSO 2 samples to be compared to one QSO 1 sample. In Section 6, we compare our findings with those of previous studies and discuss their implications in the context of AGN/QSO feedback and evolution. Finally, in Section 7, we summarise our results and present our conclusions.
- 2610.03925v1: The differences in the Narrow Line Region of nearby QSOs 1 and QSOs 2: II - Signatures of kinetic feedback
This result is consistent with the kinematics: the higher blueshift emission lines found for QSOs 1, along with the larger W 80 W80 and W 90 W90 reached in the NLR indicate higher velocities for the outflowing gas, consistent with a larger contribution from shocks.
- 2610.03925v1: The differences in the Narrow Line Region of nearby QSOs 1 and QSOs 2: II - Signatures of kinetic feedback
Regarding the outflow velocity : We adopted v b +2 σ b \sigma_{b} , but, adopting instead a smaller velocity of v b + σ b \sigma_{b} ( Dall’Agnol de Oliveira et al., 2021 , e.g.) , the results show, on average, a decrease by a factor of ∼ \sim 2 for M ˙ out \dot{\mathrm{M}}_{\mathrm{out}} and of ∼ \sim 5 for E ˙ out \dot{\mathrm{E}}_{\mathrm{out}} .
- 2606.16343v1: Optical Variability as a Probe of Hidden Nuclear Activity in Type 2 AGNs
After matching, the redshift and ⟨ r ⟩ \langle r\rangle distributions of the two samples are statistically consistent (KS p = 0.81 p=0.81 for both parameters). Figure 3 illustrates the resulting redshift and RMS cor , r \mathrm{RMS}_{\mathrm{cor},r} distributions for the matched samples. No statistically significant difference is found between their RMS cor , r \mathrm{RMS}_{\mathrm{cor},r} distributions (KS p = 0.32 p=0.32 ; Mann–Whitney p = 0.30 p=0.30 ), indicating comparable variability amplitudes under matched observational conditions.
- 2606.16343v1: Optical Variability as a Probe of Hidden Nuclear Activity in Type 2 AGNs
Results. Significant anti-correlations are found between the RMS amplitudes and [O III] 4949, [O III] 5007, [N II] 6548 and [N II] 6584 line luminosities. Velocity dispersions ( σ \sigma ) and EWs of forbidden-lines [O III] 5007 and [N II] 6584 also show moderate anti-correlations with RMS.
- 2606.04711v1: ABCD: The Nuclear Structure of the Little Red Dots Revealted through Absorption, Break, Continuum, and Decrement
Several conclusions can be drawn regarding the physical properties of the absorbers based on these measurements. The fraction of sources exhibiting Balmer absorption provides a first-order constraint on the incidence of favorable absorbing sightlines, which is on average 10 % − 20 % 10\%-20\% . This quantity should be distinguished from the covering factor inferred for individual detected absorbers, which describes the fraction of the background emission covered along those particular lines of sight. The apparent tension between the modest detection rate and the relatively high covering factors inferred in individual systems likely reflects strong selection effects. Balmer absorption is only detectable under favorable conditions, where the absorber has a sufficiently large velocity dispersion and a large flux contrast at line center, making systems with higher covering factors preferentially identified. Overall, the covering factor is expected to vary across the population but remain below unity, implying a clumpy instead of a continuous absorbing medium.
- 2606.04711v1: ABCD: The Nuclear Structure of the Little Red Dots Revealted through Absorption, Break, Continuum, and Decrement
To further investigate the structure of the broad-line gas, we construct a model based on photoionization calculations aimed at reproducing the observed velocity-dependent Balmer decrement profiles. For LRDs, constraints on the BLR column density N H N_{\rm H} are derived from the Balmer break strength (Figure 4 ), where larger N H N_{\rm H} corresponds to a stronger Balmer break. In our model, the broad-line gas is represented as an ensemble of discrete clumps distributed over a range of radii from the BH. The clump density follows a radial power-law profile, n H ∝ r − β n_{\rm H}\propto r^{-\beta} . Each clump is assigned a fixed column density N H = 10 22 cm − 2 N_{\rm H}=10^{22}\ \mathrm{cm^{-2}} , and the number of clumps is adjusted such that the integrated line-of-sight column density matches the value inferred from the Balmer break.
- 2606.28311v1: Kinematic detection of dusty outflows from active galactic nuclei: Polycyclic aromatic hydrocarbon kinematics of type 2 quasars with JWST/MIRI spectroscopy
The paper is structured as follows. In Section 2 we describe the QSOFEED sample and the MIRI MRS observations with JWST. In Section 3 we describe the method of PCA tomography and kinematic modelling of the disk kinematics. In Section 4 we present velocity maps for each target. Finally, in Section 5 we discuss our results. Throughout this work we assume Λ \Lambda CDM cosmology with H 0 = 70 H_{0}=70 km s -1 Mpc -1 , Ω m = 0.27 \Omega_{m}=0.27 , Ω Λ = 0.73 \Omega_{\Lambda}=0.73 .
- 2606.28311v1: Kinematic detection of dusty outflows from active galactic nuclei: Polycyclic aromatic hydrocarbon kinematics of type 2 quasars with JWST/MIRI spectroscopy
where there are μ × ν \mu\times\nu total spatial pixels, resulting in the data having the form of a 2D array, 𝐈 β , λ \mathbf{I}_{\beta,\lambda} . The PCA is applied to this array where
- 2601.11466v1: Pseudo Little Red Dot: an Active Black Hole Embedded in a Dense and Dusty, Metal-Poor Starburst Galaxy at z=5.96
.>, the resulting Hα/Hβ ratio could be between 7.6 and ≈ 11.0. Only the latter value is as high as the observed Hα/Hβ ratio. At the same time, one has to consider that the [OIII]/Hβ is virtually independent of dust attenuation. If the intrinsic (unattenuated) Hα/Hβ value were very low, then Pseudo-LRD-NOM would be located close to QSO1 in Fig. <ref>. The inferred gas densities would be lower, but also the necessary gas/stellar metallicities. And this would have to be coupled with high dust extinction to reproduce the observed line ratios for Pseudo-LRD-NOM, resulting in a more intriguing scenario, which we discuss in <ref>. The stellar mass derived from the SED fitting is log_10(M_⋆/M_⊙)=8.55 ± 0.20, which after correction for magnification becomes log_10(M_⋆/M_⊙)=7.21 ± 0.29 (considering μ = 21.7 ± 11.9). Considering the dust- and magnification-corrected SFR lower-limit that we derived in <ref>, i.e., SFR(Hα)0.71 ± 0.38 M_⊙ yr^-1, we get a specific SFR value log_10 (sSFR/yr^-1) -7.36 ± 0.32 (which is independent of magnification). This high minimum sSFR implies that Pseudo-LRD-NOM is a starburst galaxy, following the empirical starburst definition of <cit.>. Finally, the estimated half-light radius of the source, as obtained from the F150W-band image, is (520 ± 270) pc. After correction for magnification it becomes R_1/2= (112 ± 80) pc. This gives a stellar-mass surface density Σ_∗ = 418^+725_-310 M_⊙ / pc^2 (independent of magnification). This is similar to the stellar surface density found in massive star clusters <cit.> and even compatible within the error bars with the stellar surface density of nuclear star clusters <cit.>. ccc Best-fit SED parameters for Pseudo-LRD-NOM. Parameter Stellar + Nebular Stellar + AGN Reduced χ^2 2.05 1.12 log_10(M/ M_⊙) ^a 8.68 ± 0.72 8.55 ± 0.20 E(B-V)^b 0.33 ± 0.20 0.45 ± 0.17 Age (Myr) 124.2 ± 95.3 44.5^+44.5_-40.2 Stellar Metallicity 0.0001 ≈ 0.7% Z_⊙^ c 0.0001 ≈ 0.7% Z_⊙^ c Results at fixed z_ spec=5.96. a) The quoted stellar masses do not carry any magnification correction. b) The colour excess applies only to the stellar component. c) Considers that the solar metal fraction is Z_⊙=0.014 <cit.>.
- 2601.11466v1: Pseudo Little Red Dot: an Active Black Hole Embedded in a Dense and Dusty, Metal-Poor Starburst Galaxy at z=5.96
Conclusions We presented a detailed study of Pseudo-LRD-NOM, a source at z=5.96 which would fail the LRD classification because of its red rest-frame optical colour being mainly driven by the presence of a prominent Hα line. We inferred the presence of an active, massive black hole in Pseudo-LRD-NOM by Hα having a very broad component, whose high FWHM cannot be explained by stellar kinematics. We argued that the study of pseudo-LRDs has so far been largely neglected in the literature, but it could still be important to obtain a complete AGN census at high redshifts. Moreover, Pseudo-LRD-NOM provides evidence for an active black hole being embedded in a high-density, dusty starburst which is still at the early stages of its chemical enrichment. Pseudo-LRD-NOM is likely the precursor to a real LRD, with the massive central black-hole already in place, but without yet having the ultra-dense cocoon that would produce a prominent Balmer break in its spectrum. The study of more pseudo-LRDs residing in low-mass galaxies could be a key route to investigate the connection between massive black-hole growth and nuclear star clusters, as well as the LRD formation mechanisms. In addition, integral field spectroscopic studies with medium/high spectral resolution, with JWST and future 30-40 m-class ground-based telescopes, will be necessary to reveal in detail the dynamics and other physical processes at play in these sources. We thank Daniela Calzetti, Kohei Inayoshi, and Zu Yan for useful discussions. This work is based on observations made with the NASA/ESA/CSA JWST. The data were obtained from the Mikulski Archive for Space Telescopes at the Space Telescope Science Institute, which is operated by the Association of Universities for Research in Astronomy, Inc., under NASA contract NAS 5-03127 for JWST. These observations are associated with the JWST GTO program PID 1208. Some of the data products presented in this paper were retrieved from the Dawn JWST Archive (DJA). DJA is an initiative of the Cosmic Dawn Center (DAWN), which is funded by the Danish National Research Foundation under grant DNRF140. Also based on observations made with the NASA/ESA Hubble Space Telescope o
- 2601.15384v1: An Analysis of AGN Feedback in the Compact Galaxy Group Stephan's Quintet
Along the major axis, there is unlikely to be significant tidal influence, as the points are perpendicular to the bridge of gas. In this case, we see likely outflows up to − - 550 km s -1 at a distance of 5 . ′′ \farcs 4 (2.6 kpc) to the southeast. This is consistent with the result from [ 2 ] , who found a maximum blueshifted outflow radial velocity of − - 500 km s -1 . The mean blueshifted velocity we find is 320 ± \pm 23 km s -1 . Along the minor axis to the northeast, the points are opposite the tidal flow and also unlikely to show tidal influence. In this region, the outflows reach a peak radial velocity of − - 180 km s -1 and an extent of 4 . ′′ \farcs 5 (2.2 kpc). To the southwest in both the minor and outflowing axes, we cannot separate out the AGN outflows from the tidal flows using the kinematic plots alone. Distinguishing between the two is discussed more in § VII . Finally, there are significant redshifted velocities up to + + 250 km s -1 close to and on either side of the nucleus, which help to provide further constraints on kinematic models of the outflows.
- 2601.15384v1: An Analysis of AGN Feedback in the Compact Galaxy Group Stephan's Quintet
We generated a rotation curve of NGC 7319 based on stellar absorption features that extends out to a projected distance of 15″ (7.2 kpc). Within the inner 7″ (3.4 kpc) of the central SMBH, we were able to separate two kinematic components of ionized gas: galactic rotation and AGN-driven outflows.
- 2605.07965v1: A Changing-Look Seyfert Discovered by eROSITA Reveals a Two-Component Broad-Line Region
We deconvolved the broad H β \beta and H α \alpha profiles into two kinematic components. A broad Gaussian, with velocity widths σ \sigma typically 1800–3900 km s -1 (30–50 Å \AA ), dominated the spectra taken during the first six months after the continuum dip (January 2022 – June 2022); it is consistent with virialized gas at a radial distance of 27 ± \pm 3 lt-dy. The second component is double-peaked, and becomes more prominent in the total broad Balmer profiles starting one year after the continuum dip. It can be modeled as a diskline (flat annulus) with an inner radius of ∼ \sim 1000 R g R_{\rm g} , or 5 lt-dy. The fractional contribution of the diskline to the total profile, F DL F_{\rm DL} , increases as UV flux and m ˙ Edd \dot{m}_{\rm Edd} increase during our campaign. One possible explanation is that the diskline component has a low scale height, but as m ˙ Edd \dot{m}_{\rm Edd} increases, there is an increase in the scale height and/or radial extent of the hot and/or in particular the warm X-ray-emitting coronae; the extreme variations in warm corona luminosity that we observe could qualitatively support this notion. This increase allows a larger fraction of > > 13.6 eV photons to be intercepted by the diskline component. One can speculate if the increase in scale height may be connected to the putative warm propagating front that may drive the increase in m ˙ Edd \dot{m}_{\rm Edd} . In the context of such propagating fronts, this change in scale height could provide a physical mechanism linking the change in accretion rate with the evolution in BLR illumination.
- 2605.07965v1: A Changing-Look Seyfert Discovered by eROSITA Reveals a Two-Component Broad-Line Region
The resulting SEDs are plotted in Fig. 3 ; the spectral variability, particularly in the optical/UV regime, is readily apparent. We fit a model consisting of fAGNSED ( Kubota & Done 2018 ; Hagen & Done 2023 ) plus an Sb host galaxy template from the SWIRE template library ( Polletta et al. 2007 ) to account for host galaxy starlight, with both components absorbed and reddened only by our Galaxy. For Galactic reddening, we set E ( B − V ) E(B-V) to 0.057, based on the dust maps of Schlegel et al. (1998) . fAGNSED posits three emission regions: an optically thick, geometrically thin outer disk that encircles a warm Comptonizing region, which in turn encircles a geometrically thick, optically thin, hot Comptonizing region. In all fits we froze the co-moving distance to the source at 404 Mpc, the normalization at unity, the black hole mass to 1.4 × 10 8 M ⊙ 1.4\times 10^{8}\hbox{$\rm\thinspace M_{\odot}$} , derived via the width of the broad H β \beta emission lines as discussed in Sect. 6.3 , the dimensionless black hole spin parameter a ∗ a* at zero, the electron temperature of the hot corona, k B T e , hot k_{\rm B}T_{\rm e,hot} , at 100 keV, the hot corona’s scale height at 10 R g R_{\rm g} , and the inclination angle of the warm corona and outer disk at 15 ∘ 15^{\rm\circ} . In addition, we kept the radial size of the warm corona, R warm R_{\rm warm} , fixed to twice that of the hot corona, R hot R_{\rm hot} , in all fits. The outer radius of the disk was calculated via the self-gravity radius from Laor & Netzer (1989) , and reprocessing was included. Compared to AGNSED , fAGNSED includes a color–temperature correction for the accretion disk emission, f col f_{\rm col} , which we left as a free parameter. For the XM1–3 fits, which had the best signal-to-noise ratio, the free parameters were the accretion rate relative to Eddington, m ˙ Edd \dot{m}_{\rm Edd} , the electron temperature of the warm corona, k B T e , warm k_{\rm B}T_{\rm e,warm} , the spectral indices of the warm ( Γ warm \Gamma_{\rm warm} ) and hot ( Γ hot \Gamma_{\rm hot} ) Comptonization components, the outer radius of the hot Comptonizing component, R hot R_{\rm hot} , and the normalizat
- 2604.25991v1: The GlimmIr: Spectroscopic Variability in a z~7 LRD Indicates Rapid Changes in Both the Narrow and Broad Line Regions
Figure 5: The existence of direct sight-lines from the accretion indicates a covering fraction < 1 <1 of the broad-line gas.
- 2604.25991v1: The GlimmIr: Spectroscopic Variability in a z~7 LRD Indicates Rapid Changes in Both the Narrow and Broad Line Regions
In summary, we find a statistically significant flux increase of at least > 1.65 >1.65 for all strongly detected emission lines, and note a > 10 σ >10\sigma differences between the broad H α \mathrm{H}{\alpha} flux and [O iii ] λ λ 4960 , 5008 \lambda\lambda 4960,5008 between the epochs. These results imply several important constraints on the nature of this source:
- 2606.17144v1: Decoupled Kinematics and Excitation in the Compton-thick AGN NGC 6552: Spatially Resolved KOOLS-IFU Observations
The KOOLS-IFU field (Figure 1 ) covers the central ∼ 8.4 ′′ × 8.0 ′′ \sim 8.4^{\prime\prime}\times 8.0^{\prime\prime} region of NGC 6552 ( ∼ 4.3 × 4.1 \sim 4.3\times 4.1 kpc at z = 0.0260 z=0.0260 ). Bins with sufficient continuum S/N for emission-line analysis are concentrated within the central ∼ 2 \sim 2 kpc, enabling a spatially resolved view of ionized gas on kpc scales. Projected galactocentric distances are measured relative to the nucleus position defined from the background-subtracted JWST/MIRI F560W image [ 3 ] (cross in Figures 2 ).
- 2606.17144v1: Decoupled Kinematics and Excitation in the Compton-thick AGN NGC 6552: Spatially Resolved KOOLS-IFU Observations
Our optical results complement the mid-infrared integral-field findings of Álvarez-Márquez et al. [3] , who reported the first clear evidence for a nuclear outflow in NGC 6552 using JWST/MIRI MRS observations. In their analysis, the outflow was detected as a blue-shifted velocity component in high-excitation and coronal emission lines spanning ionization potentials of 27–187 eV, with an average peak velocity offset of − 127 ± 45 -127\pm 45 km s -1 and a maximal outflow velocity of 698 ± 80 698\pm 80 km s -1 . This mid-infrared outflow was spatially unresolved, confined to < 0.2 <0.2 kpc from the nucleus. In contrast, our KOOLS-IFU [ O iii ] λ 5007 \lambda 5007 observations reveal that the kinematic disturbance extends well beyond this nuclear region: W 80 W_{80} is maximized near the nucleus ( ∼ 830 \sim 830 km s -1 ) and declines monotonically outward, yet remains elevated ( ≳ 600 \gtrsim 600 km s -1 ) out to projected radii of ∼ \sim 1.5 kpc before falling to ∼ \sim 530–590 km s -1 at the field edges. This monotonically declining profile suggests that the nuclear outflow launched within < 0.2 <0.2 kpc gradually decelerates as it propagates outward through the host ISM.
Abstract
We compare the integrated kinematic properties of the Narrow-Line Region (NLR) of ~1500 type 1 and ~700 type 2 QSOs at 0.4 < z < 0.5 using emission-line profiles from SDSS-IV spectra. The NLR [OIII] 5007 and Hbeta emission lines are fitted using a two-component model comprising a narrow (v_n, sigma_n) and a broad component (v_b, sigma_b), while fainter lines are fitted with a single Gaussian component. Both QSO types exhibit similar median narrow-component velocities (v_n ~ 0) and velocity dispersions (sigma < 200 km s^-1), consistent with motion driven by the host galaxy's gravitational potential. However, parameters associated with the broad, high-velocity gas component (v_b, v_05, v_10, v_[NeV], sigma_b, W80 and W90) differ: QSOs 1 display larger blueshifts and broader emission lines than QSOs 2. This suggests that these components trace Active Galactic Nuclei (AGN) outflows, that appear stronger in QSOs 1, leading to higher estimated mass-outflow rates (\dot{M}_out) and kinetic powers (\dot{{E}_out). Rather than offering absolute determinations of \dot{M}_out and \dot{E}_out -- which remain subject to physical uncertainties -- this statistical study supports the higher NLR excitation found for QSOs 1 in Paper I, as an orientation effect: in QSOs 1, we observe gas closer to the AGN core, where velocities and velocity dispersions are intrinsically higher. Nevertheless, the trend of QSOs 2 exhibiting higher average [OIII] luminosities than QSOs 1 suggests an evolutionary contribution, where QSOs 2 represent an early obscured AGN phase followed by a blowout phase that reveals the central core as a QSO 1.
Discussion
Discussion access requires a security token. Register for the weekly digest.