2610.28720v1 · First listed 2026-10-22
The Balmer Absorber Strength Problem of Little Red Dots
Photoionization calculations suggest that line emission from an optically thick Balmer absorber can preferentially fill Hα, explaining inverted Hα/Hβ absorption equivalent-width ratios in some LRDs. The result is a proof-of-concept whose inferred absorber properties remain radius- and structure-dependent. [1][4]
Evidence
The observational target is the subset of LRD spectra, including RUBIES-49140, in which normalized Hα absorption is weaker than Hβ: (EW/λ)Hα < (EW/λ)Hβ. This contrasts with the standard absorption-only curve of growth, which predicts the opposite ordering at every absorber thickness. The authors calculate photoionization models with Cloudy, expressing results against the measurable n=2 hydrogen column N2 rather than the input total hydrogen column NH. They then incorporate model line source functions into a corrected curve of growth. At log(N2/cm−2) ≈ 15–17, the corrected Hα curve can cross below Hβ; the effect varies strongly with assumed absorber radius. Observational EW bands shown for RUBIES-49140 are quoted at 1σ, but no population-level incidence or fitted radius uncertainty is supplied here. [3][4][6][9]
Earlier work
Earlier LRD work found Balmer absorption along only roughly 10–20% of sightlines and interpreted individual absorbers as clumpy, with covering factors below unity. This paper provides a concrete caution for that framework: covering factors and optical depths obtained with the usual non-emitting attenuation model should not be interpreted literally once absorber self-emission matters. The supplied evidence does not provide a like-for-like reanalysis of the earlier sample using the new prescription. [13][10]
What changes
Rather than changing oscillator strengths or invoking only broadening, the paper explicitly adds the absorber’s source function to attenuation. Its proposed mechanism is differential radiative trapping: optically thick Balmer-α preferentially populates n=3, making the Hα source function stronger than Hβ while Paschen-α is not yet very optically thick. The calculation also tests Cloudy’s shielding treatment, reporting that the default implementation overpredicts N2p at high optical depth; a paired-shielding modification reproduces the cited analytic test within 10%. Thus, the model identifies line self-emission—and its radius dependence—as a potential environmental diagnostic. [1][8][2]
Limits and open questions
The authors characterize the Cloudy results as proof-of-concept. Agreement with the inverted ratio is conditional on absorber distance and internal structure, neither of which is measured in the supplied material. The crossing occurs in three of four illustrated radius cases, not universally. The modeling also depends on treatments of line trapping and shielding; the authors’ test flags a high-optical-depth failure in Cloudy’s default shielding prescription. Consequently, this supports a viable explanation for selected spectra, not a demonstrated universal origin of Balmer absorption in LRDs. [1][4][2]
The main paper is available as an abstract plus selected HTML excerpts; numerical model grids, equations, the full observational measurement procedure, and the complete sample definition were not supplied. Figure interpretation is limited to the provided captions and excerpts.
Key figures
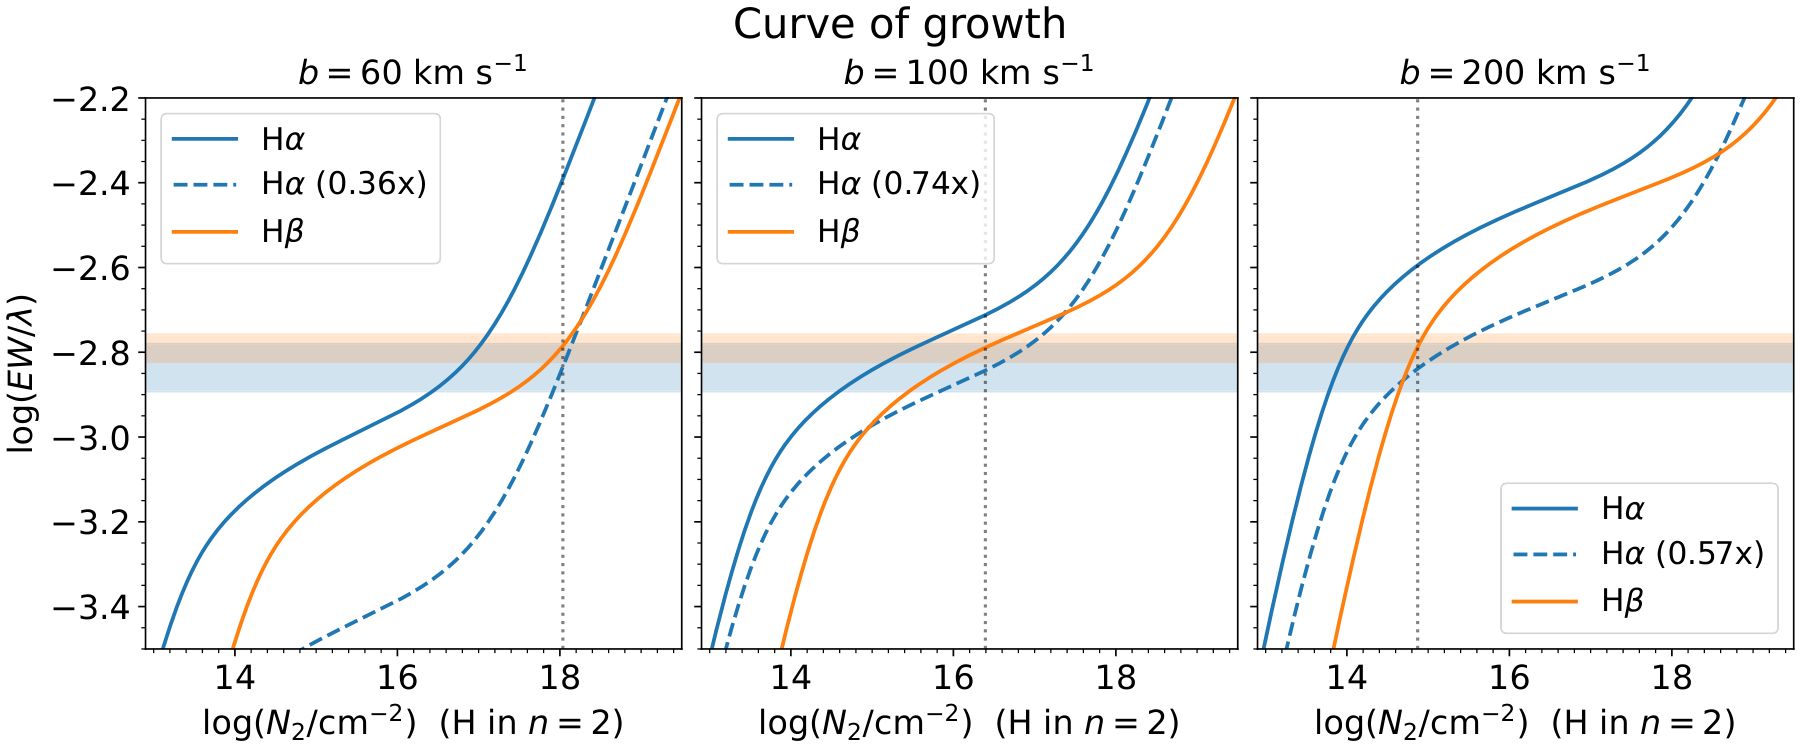
Tests the baseline discrepancy: standard curves of growth retain (EW/λ)Hα > (EW/λ)Hβ, whereas the plotted RUBIES-49140 1σ EW ranges show the reverse ordering.
Original caption
Figure 1 : The EWs of H α \alpha and H β \beta absorption as a function of n = 2 n=2 column density (known as the curve of growth). The three panels correspond to different microturbulence velocities. Shaded horizontal bands are the observationally estimated EWs for H α \alpha (blue) and H β \beta (orange) for RUBIES-49140 with ± 1 σ \pm 1\sigma uncertainties. The standard curve of growth predicts ( E W / λ ) H α > ( E W / λ ) H β (EW/\lambda)_{\rm H\alpha}>(EW/\lambda)_{\rm H\beta} for all N 2 N_{2} , contrary to observation; downward shifts of the curve of growth (conceptually illustrated with dashed curves) due to a nonzero source function could reconcile the tension.
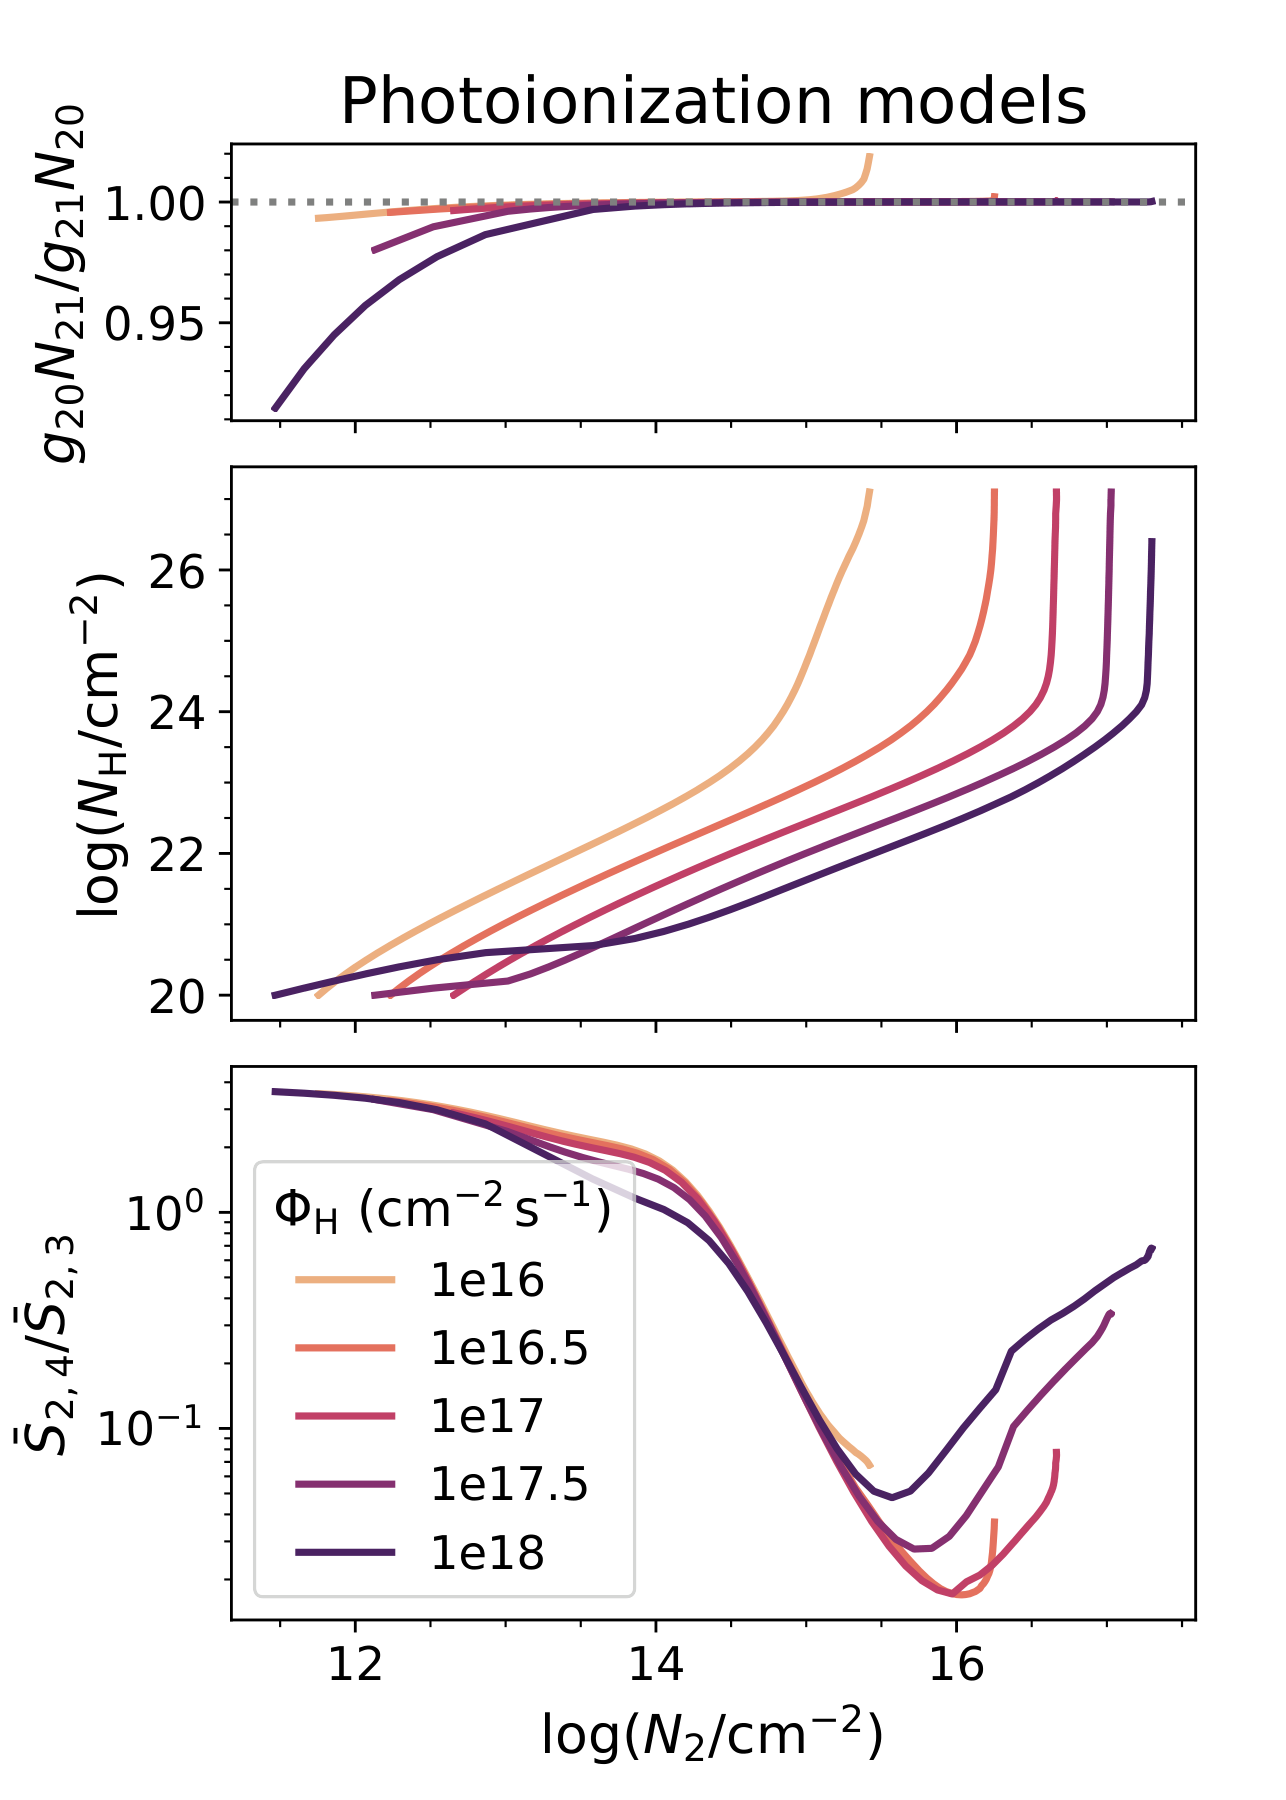
Tests whether Cloudy models can produce differential line source functions as N2 changes; the source-function ratio reaches a low valley at intermediate N2, enabling relatively weak Hα absorption.
Original caption
Figure 2 : Photoionization calculations. Each point on each curve corresponds to a cloudy absorbing medium model at a given ( N H , Φ H ) (N_{\rm H},\Phi_{\rm H}) . The horizontal axis is the measured total column density of the n = 2 n=2 population N 2 N_{2} . Top: ratio between the column densities of 2p and 2s; g 2 s N 2 p / g 2 p N 2 s = 1 g_{2s}N_{2p}/g_{2p}N_{2s}=1 indicates that 2s and 2p are ℓ \ell -mixed. Middle: relation between the input paramters N H N_{\rm H} and the measured N 2 N_{2} . They monotonically correlate with each other and follows N 2 ∝ N H N_{2}\propto N_{\rm H} at low column density. Bottom: ratio of the mean source functions of H β \beta to H α \alpha , S ¯ 2 , 4 / S ¯ 2 , 3 \bar{S}_{2,4}/\bar{S}_{2,3} . Models at intermediate N 2 N_{2} reaches a valley of S ¯ 2 , 4 / S ¯ 2 , 3 ∼ 10 − 2 \bar{S}_{2,4}/\bar{S}_{2,3}\sim 10^{-2} , which facilitates weak H α \alpha absorption relative to H β \beta .
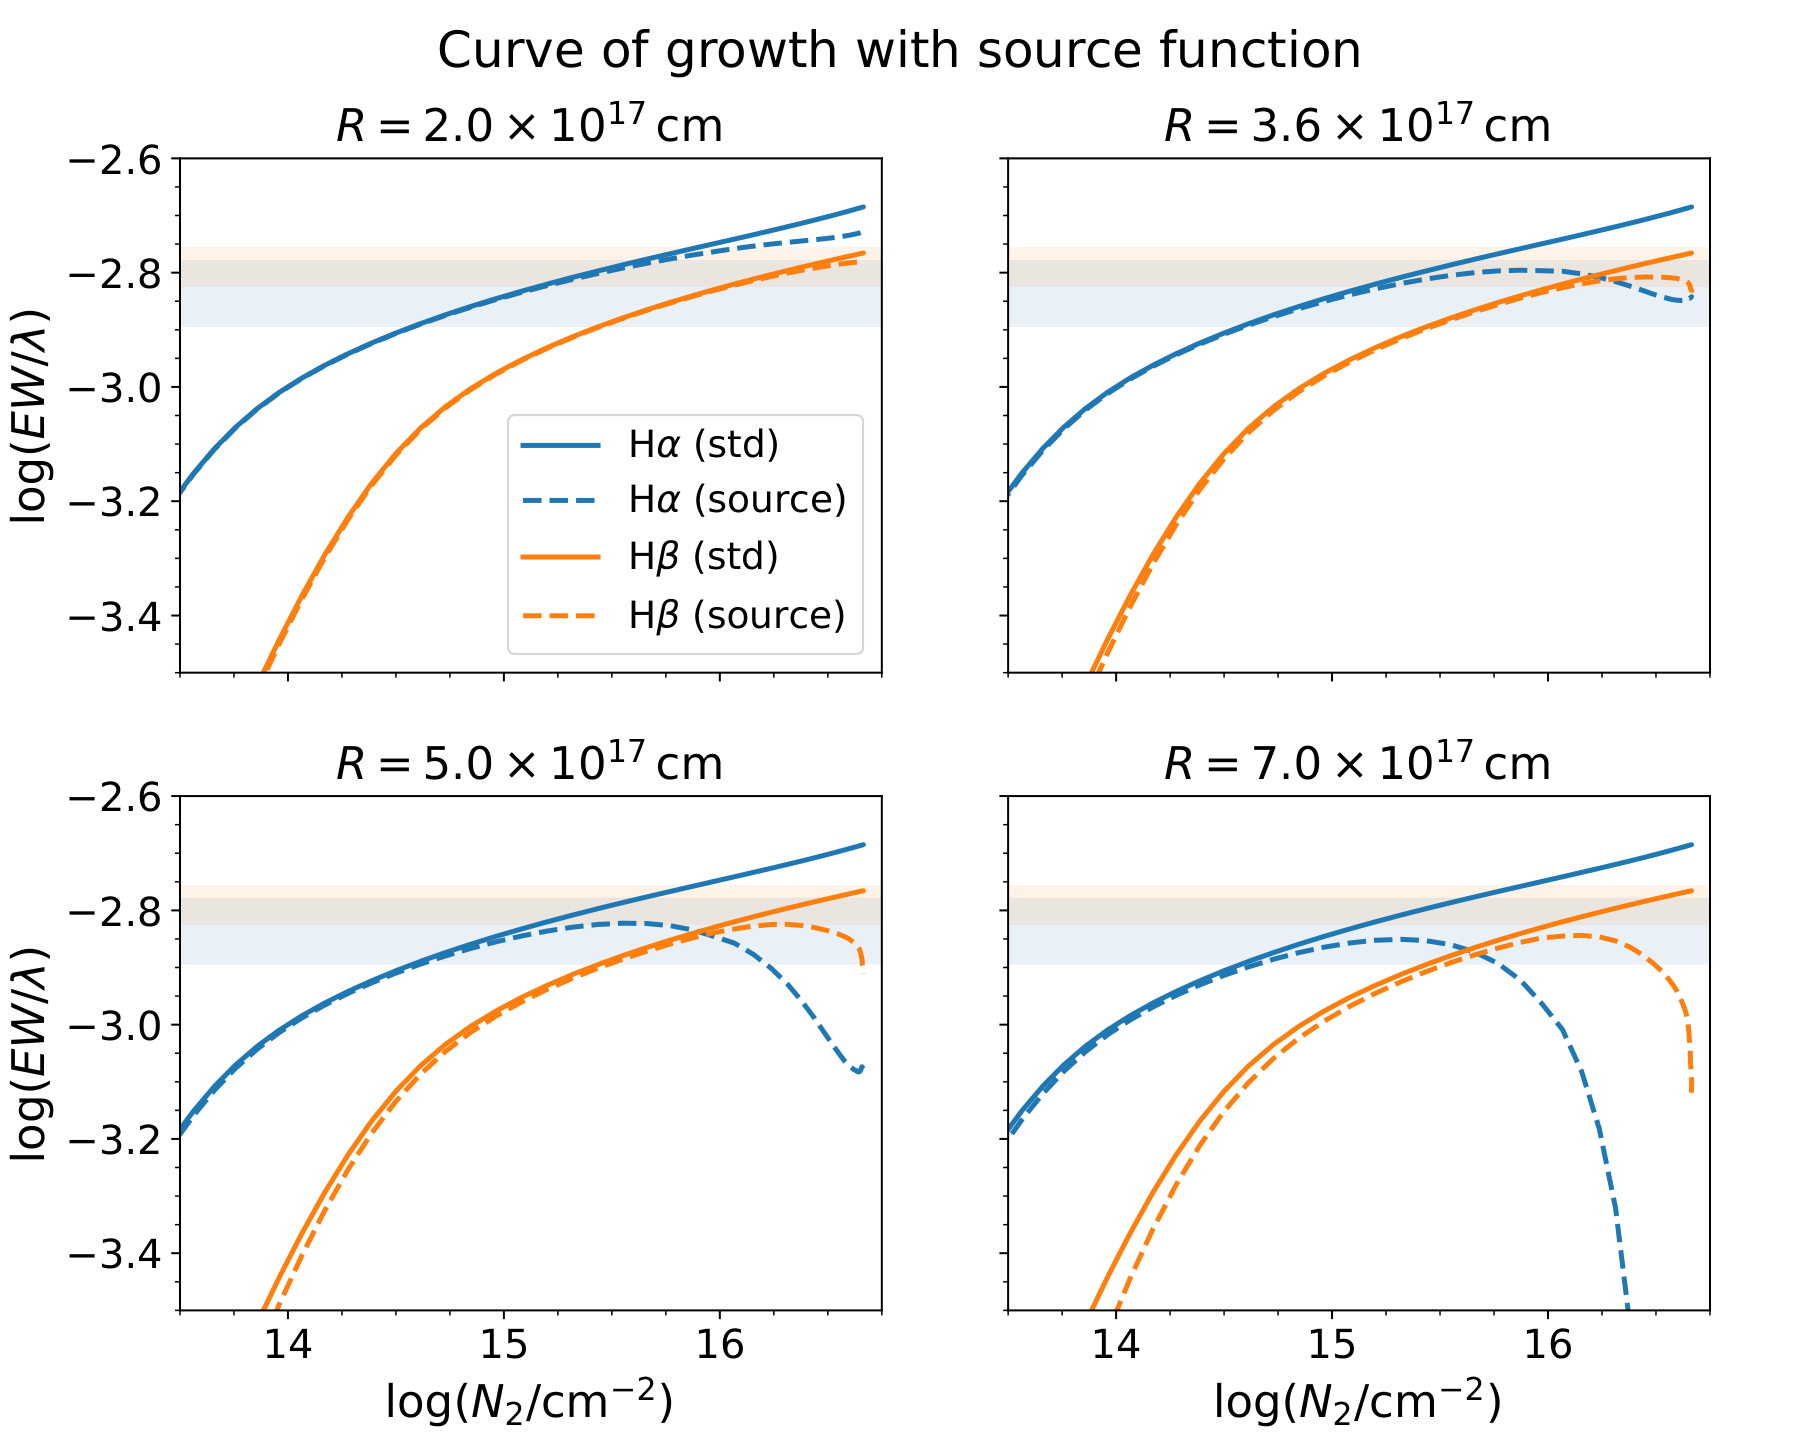
Tests the observational consequence of adding source functions to the curve of growth. The Hα and Hβ curves can cross near log(N2/cm−2) ≈ 15–17, with the outcome depending on absorber radius.
Original caption
Figure 4 : Curve of growth with source function. The solid curves are the standard curves of growth, indentical to the middle panel in Figure 1 . The dashed curves are the source-corrected curves using the source function from cloudy models (with fixed log ( Φ H / cm − 2 s − 1 ) = 17 \log(\Phi_{\rm H}/{\rm cm^{-2}\,s^{-1}})=17 and b = 100 km s − 1 b=100{\rm~km\,s^{-1}} ) and the observed broad-line luminosities of RUBIES-49140 (Equations 3 , 8 ); c.f. Figure 1 , where the dashed curves are only conceptual illustrations without microphysical modeling. Shaded horizontal bands are the observationally estimated EWs for H α \alpha (blue) and H β \beta (orange) for RUBIES-49140 with 1 σ \sigma uncertainties. Depending on the radius of the absorbing medium, the EW could strongly deviate from the standard at high column densities and could be weaker in H α \alpha than in H β \beta .
Related research
Previous digest
Liu et al. address the inverted Balmer-absorption strengths seen in some little red dots, where Hα is weaker than Hβ despite standard attenuation and curve-of-growth arguments requiring the opposite. Using proof-of-concept Cloudy photoionization models, they show that emission from an optically thick absorber can fill in the Hα trough more efficiently than Hβ: radiative trapping preferentially populates hydrogen’s n=3 level when Hα is trapped but Paschen-α remains comparatively thin. Applied to RUBIES-49140, source-function-corrected curves of growth can reproduce the observed ordering, turning the Hα/Hβ absorption ratio into a diagnostic of absorber radius and internal structure, with possible implications for estimating the central-engine mass.
Sources and evidence (26)
- 2610.28720v1: The Balmer Absorber Strength Problem of Little Red Dots
Little Red Dots (LRDs) commonly show Balmer absorption features. Some observed LRD spectra have weaker absorption in H$α$ than in H$β$, in apparent contradiction to atomic physics according to standard attenuation models. This tension is naturally resolved when one considers emission from the absorbing medium itself, which is ignored in the standard model: when the Balmer absorption is optically thick, a non-negligible source function could fill in the H$α$ absorption trough and reduce its observed absorption equivalent width (EW). With proof-of-concept photoionization models we show that the source function of H$α$ could be systematically stronger than that of H$β$. This is due to radiative trapping preferentially populating the $n=3$ level of neutral hydrogen, which operates efficiently when the medium is optically thick to H$α$ but not very optically thick to Paschen-$α$. Such line-dependent source functions could lead to significant corrections to the expected EW and selectively weaken H$α$ absorption, consistent with observations. Quantitatively, this depends on the distance of the absorbing medium and its internal structure, providing a new diagnostic of the environment around LRDs. Future modeling of the absorbers may also potentially open a new avenue for estimating the mass of the central engine.
- 2610.28720v1: The Balmer Absorber Strength Problem of Little Red Dots
We run the above test setup for a range of N H N_{\rm H} . Figure 6 shows the test result. The paired shielding implementation in this work reproduces Equation ( B2 ) (grey dashed line) to within 10%. In contrast, while the default treatment agrees with the analytical prediction in the optically thin limit, where all probabilities approaches unity, it severely overpredicts N 2 p N_{2p} at the high-optical depth end. There, the blue curve scales approximately as N 2 p / N H ∝ N H 1 / 2 N_{2p}/N_{\rm H}\propto N_{\rm H}^{1/2} , as expected from our discussion above.
- 2610.28720v1: The Balmer Absorber Strength Problem of Little Red Dots
Figure 2 shows the results of cloudy calculations. Different from convention, we present the measured quantity N 2 N_{2} at the horizontal axes instead of the input parameter N H N_{\rm H} , which is shown on the vertical axes in the middle panel. This arrangement makes the plots more similar to the curve of growth and improves physical interpretability.
- 2610.28720v1: The Balmer Absorber Strength Problem of Little Red Dots
Figure 4 shows the results. The standard curves of growth (solid) are identical to those in the middle panel in Figure 1 . The curves that consider the source function (dashed) depart from the standard ones in non-trivial ways. For fixed values of S ¯ 2 , 3 \bar{S}_{2,3} and S ¯ 2 , 4 \bar{S}_{2,4} , a small radius of the absorbing medium implies a weak correction term to the EW by Equation ( 8 ), as shown in the top-left panel. However, if we assume larger radii, the source correction will strongly bend the curves. Importantly, the trough in S ¯ 2 , 4 / S ¯ 2 , 3 \bar{S}_{2,4}/\bar{S}_{2,3} in Figure 2 implies that the H α \alpha EW could decrease more significantly than H β \beta at log ( N 2 / cm − 2 ) ∼ 15 \log(N_{2}/{\rm cm^{-2}})\sim 15 –17. Indeed, the source-corrected H α \alpha curve starts to deviate from the standard one at log ( N 2 / cm − 2 ) ∼ 15 \log(N_{2}/{\rm cm^{-2}})\sim 15 across the four panels, and a crossing between the H α \alpha and H β \beta curves happens in three of the four panels here. After the crossing, we expect the same column density to produce ( E W / λ ) H α < ( E W / λ ) H β (EW/\lambda)_{\rm H\alpha}<(EW/\lambda)_{\rm H\beta} , as observed in RUBIES-49140. When the radius of the medium is large, the EW could even become zero or negative for H α \alpha while staying large for H β \beta ; by then, only H β \beta would show an absorber at all.
- 2610.28720v1: The Balmer Absorber Strength Problem of Little Red Dots
Observations of the Balmer absorbers of LRDs have identified a problem: the absorption EW ratio of H α \alpha to H β \beta can be much lower than expected from the standard attenuation model. However, the standard attenuation model assumes that the absorbing medium does not emit light in its own right. Considering the source function of this medium can naturally resolve the tension. Based on this central idea, we propose a modified attenuation model that considers the source function (Equation 2 ). Our main conclusions are as follows.
- 2610.28720v1: The Balmer Absorber Strength Problem of Little Red Dots
Observations of some LRDs such as RUBIES-EGS-49140 show that ( E W / λ ) H α < ( E W / λ ) H β (EW/\lambda)_{\rm H\alpha}<(EW/\lambda)_{\rm H\beta} . This poses a tension with the standard curve of growth, which predicts ( E W / λ ) H α > ( E W / λ ) H β (EW/\lambda)_{\rm H\alpha}>(EW/\lambda)_{\rm H\beta} for any thickness of the absorbing medium (Figure 1 ).
- 2610.28720v1: The Balmer Absorber Strength Problem of Little Red Dots
Including the source function into the standard attenuation model scales down the predicted equivalent width (Equations 2 , 3 ). The correction can be different for H α \alpha and H β \beta .
- 2610.28720v1: The Balmer Absorber Strength Problem of Little Red Dots
Proof-of-concept photoionization models using cloudy show that the source function of H α \alpha could be systematically stronger than that of H β \beta (Figure 2 ) due to radiative trapping, which operates efficiently when the absorbing medium is optically thick to H α \alpha but not very optically thick to Paschen- α \alpha (Figure 3 ).
- 2610.28720v1: The Balmer Absorber Strength Problem of Little Red Dots
The source-corrected curve of growth could show inverted H α \alpha -to-H β \beta EW ratios, consistent with observations (Figure 4 ). The EWs are sensitive to the location of the absorbing medium.
- 2610.28720v1: The Balmer Absorber Strength Problem of Little Red Dots
Our results motivate a more general attenuation model than that commonly assumed in the literature (see Equation 2 ). With the source function, the optical depth and covering factor measured from the standard attenuation model should not be taken at face value. Our conclusion aligns with the emerging picture that many LRD features share similarities with stellar phenomena and could be understood with physics in that context [ 63 , 44 , 54 , 13 , 64 , 62 , e.g.,] . Indeed, a stellar atmosphere has practically infinite optical depth for the Balmer lines, yet their EWs are fully governed by the source function rather than follow the standard curve of growth (which would predict infinity).
- 2505.06359v1: JWST/NIRSpec Observations of High Ionization Emission Lines in Galaxies at High Redshift
Progress requires continued efforts to identify Type II AGN as JWST spectroscopic samples grow in number. We have presented an N V emitter at z = 8.7 z=8.7 without broad lines in its rest-frame optical spectrum. This galaxy has a large [O III ]+H β \beta EW ( 1682 1682 Å) and a very blue continuum slope ( β = − 2.5 \beta=-2.5 ), comparable to other systems dominated by very young stellar populations at similar redshifts. This galaxy is one of a small sample of Type II AGN candidates at z ≳ 4 z\gtrsim 4 discovered with JWST spectroscopy [ 135 , 162 , 108 , 25 , 141 ] . Our investigation of 851 851 public NIRSpec grating spectra suggests that the fraction of z ≳ 4 z\gtrsim 4 galaxies with high ionization lines (N V , He II , [Ne IV ], [Ne V ]) is 2.2 − 1.0 + 1.7 % 2.2^{+1.7}_{-1.0}\% , where here this census refers only to lines with EW > 10 >10 Å. This percentage is broadly similar to that measured in ground-based follow-up of UV-selected galaxies at z ≃ 2 − 3 z\simeq 2-3 [ 54 , e.g.,] . We emphasize that this number should be considered as merely the fraction of galaxies with very high ionization lines and not as an AGN fraction. Deeper spectra will be required to validate low S/N detections and isolate the most likely powering mechanism (i.e., shocks, AGN).
- 2505.06359v1: JWST/NIRSpec Observations of High Ionization Emission Lines in Galaxies at High Redshift
4. We explore the incidence of very high ionization emission (N V , He II , [Ne IV ], [Ne V ]) in a sample of 851 851 continuum-selected z > 4 z>4 galaxies and 18 18 z > 4 z>4 LRDs with moderate or high resolution NIRSpec observations covering the rest-frame UV. We find that 2.2 − 1.0 + 1.7 % 2.2^{+1.7}_{-1.0}\% of the z > 4 z>4 galaxy population has spectra with plausible detections of the very high ionization lines with EW > 10 >10 Å. This fraction is comparable to that seen at lower redshifts in continuum-selected samples [ 54 ] , although a direct comparison is challenging given existing current EW limits. Most LRDs do not yet have spectra deep enough to constrain the full suite of narrow high ionization UV lines (N V , C IV , He II , [Ne IV ], [Ne V ]) to EWs of 10 10 Å, but the very limited samples suggest these lines are present in a subset of LRDs ( 25.0 − 20.8 + 37.1 % 25.0^{+37.1}_{-20.8}\% for N V , 12.5 − 10.4 + 23.7 % 12.5^{+23.7}_{-10.4}\% for C IV ). However, these results suggest that high ionization lines are weak in the majority of LRDs, potentially signally a softer ionizing spectrum or blanketing of the radiation field by dense neutral gas and dust.
- 2606.04711v1: ABCD: The Nuclear Structure of the Little Red Dots Revealted through Absorption, Break, Continuum, and Decrement
Several conclusions can be drawn regarding the physical properties of the absorbers based on these measurements. The fraction of sources exhibiting Balmer absorption provides a first-order constraint on the incidence of favorable absorbing sightlines, which is on average 10 % − 20 % 10\%-20\% . This quantity should be distinguished from the covering factor inferred for individual detected absorbers, which describes the fraction of the background emission covered along those particular lines of sight. The apparent tension between the modest detection rate and the relatively high covering factors inferred in individual systems likely reflects strong selection effects. Balmer absorption is only detectable under favorable conditions, where the absorber has a sufficiently large velocity dispersion and a large flux contrast at line center, making systems with higher covering factors preferentially identified. Overall, the covering factor is expected to vary across the population but remain below unity, implying a clumpy instead of a continuous absorbing medium.
- 2606.04711v1: ABCD: The Nuclear Structure of the Little Red Dots Revealted through Absorption, Break, Continuum, and Decrement
To further investigate the structure of the broad-line gas, we construct a model based on photoionization calculations aimed at reproducing the observed velocity-dependent Balmer decrement profiles. For LRDs, constraints on the BLR column density N H N_{\rm H} are derived from the Balmer break strength (Figure 4 ), where larger N H N_{\rm H} corresponds to a stronger Balmer break. In our model, the broad-line gas is represented as an ensemble of discrete clumps distributed over a range of radii from the BH. The clump density follows a radial power-law profile, n H ∝ r − β n_{\rm H}\propto r^{-\beta} . Each clump is assigned a fixed column density N H = 10 22 cm − 2 N_{\rm H}=10^{22}\ \mathrm{cm^{-2}} , and the number of clumps is adjusted such that the integrated line-of-sight column density matches the value inferred from the Balmer break.
- 2603.17667v1: The Engine and its Flows: Little Red Dot spectra are shaped by the column densities of their gas envelopes
The key result from Figure 2 is that the shape of the Balmer emission lines correlates with the UV to optical color. The reddest sources have Balmer lines that are most dominated by the broad wings and that show absorption features close to the systemic redshift ( Matthee et al., 2024 ; D’Eugenio et al., 2025a , e.g.) . The reddest sub-set also shows narrow H β \beta line-emission at the line center with an identical profile as the [O iii ] line. The bluest sources show Balmer lines that are dominated by strong, narrow emission at the line center. Among the intermediate sub-sets, the broad components become increasingly dominant the redder the broad-band spectrum is, the absorption features increasingly strong and shifted closer to the systemic redshift. The Balmer lines show exponential wings ( Rusakov et al., 2025 , see also) with similar FWHM ≈ 1400 \approx 1400 km s -1 . While the broad-to-total flux ratio generally increases for red sources, there are subtle differences between H α \alpha and H β \beta . In the bluer sub-sets, the H α \alpha line has relatively stronger wings than H β \beta . For the redder sub-sets, it is the opposite case where the wings of the H β \beta lines contain a higher fraction of the flux, compared to H α \alpha . Generally, there are little variations among the [O iii ] profiles that are in most cases very narrow.
- 2603.17667v1: The Engine and its Flows: Little Red Dot spectra are shaped by the column densities of their gas envelopes
Figure 5 shows our best fits to the Balmer line profiles of four sources with deep, high resolution data from our IFU program that span the range in UV to optical colors. Broad exponential components are identified in all H α \alpha profiles, with FWHMs ≈ 1400 \approx 1400 km s -1 . In H β \beta , the profile of the broad component is exponential for the sources with highest signal to noise ratio. The FWHM of the exponential components of the H β \beta lines are on average somewhat higher, which is at odds with expectations from Thomson scattering through a uniform medium, but we discuss modeling limitations in Section 4.2 that could impact this comparison. Comparing the H α \alpha /H β \beta ratios of the exponential components alone, we find H α \alpha /H β ≈ 8.1 \beta\approx 8.1 , ranging from 4.4 − 13.8 4.4-13.8 .
- 2507.23774v1: Lord of LRDs: Insights into a "Little Red Dot" with a low-ionization spectrum at z = 0.1
The above results suggest J1025+1402 is extremely X-ray weak compared to typical AGN in the local Universe. In Figure 14 , we compare the bolometric-to-X-ray luminosity ratio of J1025+1402 with those of optically selected local AGN as well as high- z z broad-line AGN and LRDs selected by JWST . In this plot, all X-ray limits included represent 90% confidence limits. While J1025+1402 lies at the low-luminosity end, it has L bol / L 2 − 10 keV > 131 L_{\rm bol}/L_{\rm 2-10~keV}>131 as the 3 σ 3\sigma limit and L bol / L 2 − 10 keV > 336 L_{\rm bol}/L_{\rm 2-10~keV}>336 as the 90% confidence limit (assuming a standard bolometric conversion from H α \alpha from Stern & Laor, 2012 ), which is significantly higher compared to the local AGN, and even the current limits for JWST -selected Type 1 AGN and LRDs. For comparison, we plot two bright LRDs, the Rosetta Stone and the Monster, which have more stringent limits on L bol / L 2 − 10 keV L_{\rm bol}/L_{\rm 2-10~keV} but have 1 − 2 1-2 magnitudes higher nominal bolometric luminosities.
- 2507.23774v1: Lord of LRDs: Insights into a "Little Red Dot" with a low-ionization spectrum at z = 0.1
The extreme apparent X-ray weakness of J1025+1402 might potentially indicate similarly extreme levels of obscuration in this system. To investigate this further, we estimate the absorption columns that would be needed to result in the X-ray non-detections reported above, under the assumption that J1025+1402 should intrinsically be similar to other AGN. To do so, we use the information provided in Table 4 along with the λ Edd \lambda_{\rm{Edd}} -dependent 2–10 keV bolometric corrections ( κ 2 − 10 \kappa_{2-10} ) presented for type-1 AGN in Lusso et al. (2012) to predict what the intrinsic 2–10 keV luminosity ( L pred , int L_{\rm{pred,int}} ) of J1025+1402 should be (and in the case of the 10-30 keV band, subsequently determine the predicted intrinsic 10–30 keV luminosity assuming a Γ = 1.7 \Gamma=1.7 powerlaw continuum). We then determine what the observed luminosity ( L pred , obs L_{\rm{pred,obs}} ) should be for a range of different line-of-sight column densities at the redshift of J1025+1402, accounting for losses due to both photoelectric absorption and scattering using models for both included in xspec ( Arnaud 1996 ). These predicted luminosities are then compared to the corresponding limit on the luminosity provided by the X-ray data (which are also re-computed for each value of N H N_{\rm{H}} considered; we again consider 90% confidence limits here, as in Figure 14 ).
- 2609.22623v1: Balmer Absorption Series and Broad Metal Lines in Two Luminous Little Red Dots
The decomposition and characterization of H α \alpha –H δ \delta , together with the identification of broad lines, most notably in [Ne iii ], comprise the two major findings of this paper. In this section, we first present the hydrogen and helium profiles (Section IV.1 - IV.2 ). We then turn to the metal lines (Section IV.3 ) and the photoionization diagnostics enabled by these measurements (Section IV.4 ).
- 2609.22623v1: Balmer Absorption Series and Broad Metal Lines in Two Luminous Little Red Dots
In this section, we first place the two sources studied here in the context of the broader LRD absorber population, summarizing what is distinctive about them as well as what they share with the broader population (Section V.1 ). We then turn to the constraints provided by the high-resolution, high-S/N spectra presented in this paper (Section V.2 ), and finally consider physical interpretations of the puzzling feature regarding the trends in absorber velocities across the Balmer series (Sections V.3 – V.4 ).
- 2509.09607v1: Discovery of Multiply Ionized Iron Emission Powered by an Active Galactic Nucleus in a z~7 Little Red Dot
We measure three Balmer lines: H α \mathrm{H}{\alpha} , H β \mathrm{H}{\beta} , and H γ \mathrm{H}{\gamma} . The detailed line decomposition procedure is reported in the Methods; in brief, we find complex line component features within the Balmer lines. In summary, all detected Balmer lines contain evidence of at least one broad component tracing gas at ∼ \sim 3000 km s -1 via the FWHMs of the respective features. The Balmer emission lines are significantly broad-line dominated – with narrow components comprising only a marginal percentage of their total flux. Though we note the H β \mathrm{H}{\beta} and H α \mathrm{H}{\alpha} complexes have strong central absorption components, this yields a significant degeneracy in accurately decomposing the narrow line components at their respective line centers. Figure 2 highlights the and respective multicomponent fits to the three detected Balmer lines.
- 2509.09607v1: Discovery of Multiply Ionized Iron Emission Powered by an Active Galactic Nucleus in a z~7 Little Red Dot
In summary, we report the first discovery of several rare iron transitions, including a possible [Fe vii ] λ 5160 \lambda 5160 detection, in the little red dot THRILS_46403 at z = 6.68476 z=6.68476 . We also measure significant narrow Balmer absorption in both H α \mathrm{H}{\alpha} and H β \mathrm{H}{\beta} . The small velocity widths of the absorber, in conjunction with the detected lines that require direct, unobscured attenuation from the accretion disk, indicate that the source of the absorber is on scales at (or beyond) the broad-line gas region and a covering fraction that does not completely occlude the broad-line region.
- 2503.05537v1: Little Red Dots as the Very First Activity of Black Hole Growth
Figure 2: Left : The redshift dependence of the AGN comoving number density. Each modeled curve presents the AGN population that undergo n n -th AGN active episodes, illustrating the distribution of the total elapsed time T n T_{n} ( 1 ≤ n ≤ 8 1\leq n\leq 8 ): the first (magenta), second (green), third (cyan), fourth (orange) episodes, as well as the total population in this model (black). The normalization is set such that the modeled LRD abundance is consistent with the observed ones [ 26 , 25 , red symbols,] . The total AGN predicted in this model agrees with measurements of AGN abundances in the range 0 < z < 5 0<z<5 [ 46 , gray symbols,] . Right : The fraction of non-LRDs (black solid; model) and observational constraints on the fraction (95% confidence level) derived from a sample of 53 broad-line AGNs [ 44 , blue symbol,] . The shaded region indicates the range of uncertainty due to the choice of the absolute time origin for the LRD occurrence distribution.
- 2503.05537v1: Little Red Dots as the Very First Activity of Black Hole Growth
In the right panel of Figure 2 , we show the fraction of AGNs that have experienced their second or later episodes relative to the total AGN population, representing the fraction of non-LRDs under this hypothesis. Since a significant fraction of BHs undergo a second episode at z < 5 z<5 , this fraction increases rapidly and reaches unity by z ∼ 3 z\sim 3 . For comparison, we overlay observational constraints on the fraction of unobscured (non-LRD) AGNs (95% confidence level), derived from a sample of 53 spectroscopically confirmed broad-line AGNs in the redshift range of 3.5 < z < 6 3.5<z<6 [ 44 ] . At z ≤ 6 z\leq 6 , the sample size in each redshift bin is sufficiently large to reveal a trend that closely follows the model prediction (black solid) 2 2 2 Since the sample size at 6 < z < 7 6<z<7 is too small for robust statistical analysis (one LRD and two unobscured AGNs), we do not include the data in the right panel of Figure 2 . Statistical uncertainties are evaluated using the Clopper‐Pearson method. .
- 2503.16596v1: A "Black Hole Star" Reveals the Remarkable Gas-Enshrouded Hearts of the Little Red Dots
Table Extended Data 1: Summary of key properties.
- 2503.16596v1: A "Black Hole Star" Reveals the Remarkable Gas-Enshrouded Hearts of the Little Red Dots
We thank the PRIMER and EXCELS teams for designing JWST surveys that made this work possible. We acknowledge feedback on ”BH*” and illuminating discussions with Ivan Cabrera-Ziri, Mike McDonald, Roger Blandford, Susan Clark, Risa Wechsler, Tom Abel, Mike Liu, Dave Sanders, Sylvain Veilleux, Triana Almeyda, Adam Ginsburg, and Desika Narayanan. We thank Kohei Inayoshi for discussing details of their work modeling Balmer breaks in LRDs [ 8 ] . This work is based on observations made with the NASA/ESA/CSA James Webb Space Telescope. The data were obtained from the Mikulski Archive for Space Telescopes at the Space Telescope Science Institute, which is operated by the Association of Universities for Research in Astronomy, Inc., under NASA contract NAS 5-03127 for JWST. These observations are associated with programs 5224 and 3543. Some of the data products presented herein were retrieved from the Dawn JWST Archive (DJA). DJA is an initiative of the Cosmic Dawn Center (DAWN), which is funded by the Danish National Research Foundation under grant DNRF140. We acknowledge funding from JWST programs GO-3516, GO-5224, and GO-1837. Support for this work was provided by NASA through the NASA Hubble Fellowship grant HST-HF2-51515.001-A awarded by the Space Telescope Science Institute, which is operated by the Association of Universities for Research in Astronomy, Incorporated, under NASA contract NAS5-26555. Funded by the European Union (ERC AGENTS, 101076224; HEAVYMETAL, 101071865; RED CARDINAL, 101076080). Views and opinions expressed are however those of the author(s) only and do not necessarily reflect those of the European Union or the European Research Council. Neither the European Union nor the granting authority can be held responsible for them. This work has received funding from the Swiss State Secretariat for Education, Research and Innovation (SERI) under contract number MB22.00072, as well as from the Swiss National Science Foundation (SNSF) through project grant 200020_207349. This work was also supported by JSPS KAKENHI Grant Numbers 23H00131. The Cosmic Dawn Center is funded by the Danish National Research Foundation under grant DNRF140. P.N. acknowledges supp
Abstract
Little Red Dots (LRDs) commonly show Balmer absorption features. Some observed LRD spectra have weaker absorption in H$α$ than in H$β$, in apparent contradiction to atomic physics according to standard attenuation models. This tension is naturally resolved when one considers emission from the absorbing medium itself, which is ignored in the standard model: when the Balmer absorption is optically thick, a non-negligible source function could fill in the H$α$ absorption trough and reduce its observed absorption equivalent width (EW). With proof-of-concept photoionization models we show that the source function of H$α$ could be systematically stronger than that of H$β$. This is due to radiative trapping preferentially populating the $n=3$ level of neutral hydrogen, which operates efficiently when the medium is optically thick to H$α$ but not very optically thick to Paschen-$α$. Such line-dependent source functions could lead to significant corrections to the expected EW and selectively weaken H$α$ absorption, consistent with observations. Quantitatively, this depends on the distance of the absorbing medium and its internal structure, providing a new diagnostic of the environment around LRDs. Future modeling of the absorbers may also potentially open a new avenue for estimating the mass of the central engine.
Discussion
Discussion access requires a security token. Register for the weekly digest.