2610.29137v1 · First listed 2026-10-22
NGC 3227 Blinks: An Extreme Changing-Look Event in a Seyfert Galaxy
High-cadence monitoring of one Seyfert changing-look episode finds that NGC 3227’s continuum and broad Hβ dimmed sharply yet retained a 6–8-day reverberation lag, supporting an inner, high-column obscurer rather than ordinary stochastic accretion variability. [1][3]
Evidence
The sample is a single rapid event in NGC 3227, monitored with WIRO optical spectroscopy, inter-calibrated ZTF photometry during the obscuration phase, and simultaneous Swift X-ray data. The authors report declines of about 70% at rest-frame 5100 Å and 80% in broad Hβ, followed by recovery within two months; X-ray hardening coincided with the decline. They test normal stochastic variability using damped-random-walk simulations calibrated to the source’s ordinary variability and obtain p=0.002. Independent ICCF and MICA reverberation analyses give a persistent continuum-to-Hβ delay of roughly 6–8 days in the dim phase. The authors interpret this coherent positive delay as continued BLR reprocessing of an attenuated ionizing continuum, locating the obscurer inside the BLR. Photoionization modeling requires a fully ionized Compton-thick line-of-sight column, NH≈1.5×10^24 cm−2, to reproduce the optical suppression. [1][5][2][3]
Earlier work
The paper frames changing-look behavior as potentially caused either by intrinsic accretion-flow changes or changing obscuration; X-ray hardening is an expected signature of the latter. Its concrete comparison is with Mrk 817: an inner obscurer there was associated with a BLR “holiday,” in which broad UV lines decoupled from the observed continuum. In NGC 3227, by contrast, Hβ retained a ∼6–8-day lag while both continuum and broad-line emission were strongly suppressed. The authors therefore distinguish a reverberating, attenuated Hβ response from the Mrk 817 holiday, rather than claiming the same phenomenology. [4][8][9]
What changes
The central addition is the combination of an extreme optical changing-look transition with phase-resolved reverberation mapping. The persistent lag is used geometrically: an obscurer external to the BLR would directly attenuate broad-line emission and would need to cover much of that extended region to reduce Hβ by ∼80%; a transiting screen would also predict differently timed or smeared continuum and line changes. The authors instead favor an interior screen that reduces ionizing radiation before it reaches the BLR. This is an inference from the measured timing and modeled attenuation, not a direct image or identification of the obscuring structure. [2][6][3]
Limits and open questions
The inferred Compton-thick optical column exceeds the reported X-ray-derived column by one to two orders of magnitude. The authors caution that no X-ray observation sampled the deepest optical minimum, that the X-ray column was evolving, and that X-rays and optical continuum probe different emitting scales and sightlines; thus the two columns are not a simultaneous direct consistency test. The physical identity of the obscurer—such as a disk wind versus another circumnuclear structure—remains undetermined. Lag precision is represented through MICA reconstruction and ICCF centroid distributions, but the supplied extraction does not provide their numerical confidence intervals. [7][8]
The main paper is supported by abstract and selected HTML-section extractions plus supplied figure captions. No full methods tables or numerical lag confidence intervals were supplied; figure descriptions therefore avoid unextracted quantitative details.
Key figures
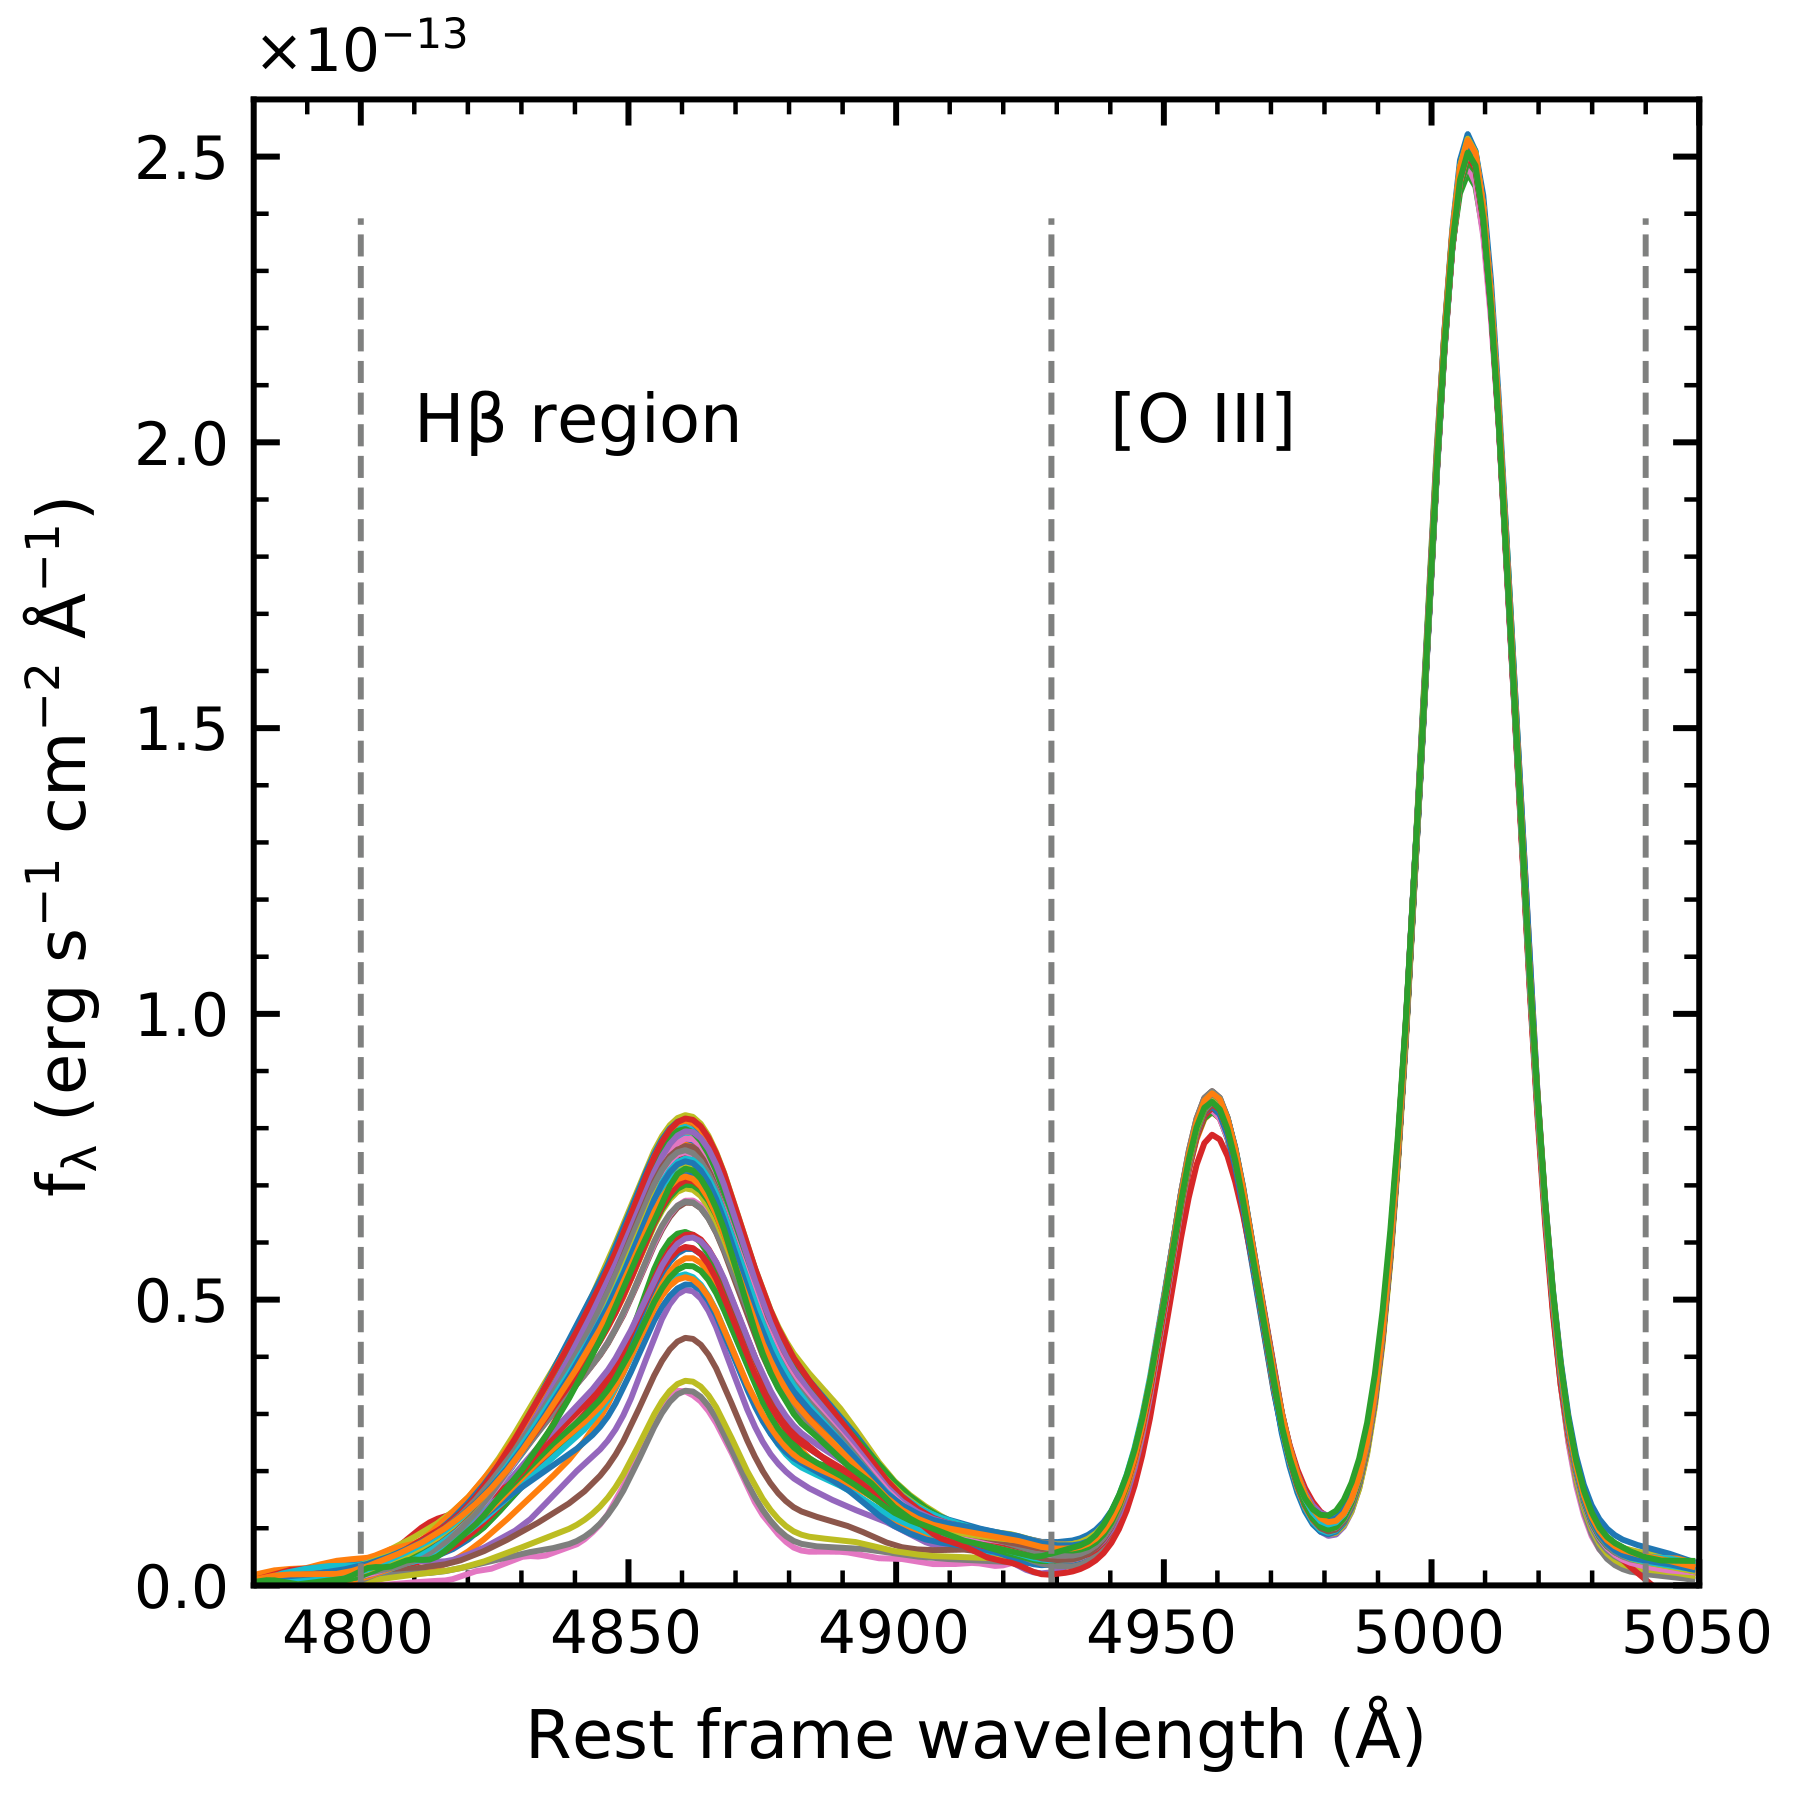
Tests whether the broad-line change is real rather than a flux-calibration artifact: continuum-subtracted, host-subtracted epochal profiles show Hβ varying by over a factor of two while narrow [O III] remains essentially constant as an internal reference.
Original caption
Figure 2: Continuum-subtracted H β \beta and [O iii ] emission-line profiles, one colored curve per epoch of the 2019–2020 campaign, after subtraction of the host galaxy and a local linear continuum (windows at 4750–4790 and 5075–5125 Å). The H β \beta profile, containing both broad and narrow-line components, varies by more than a factor of two between epochs, while the narrow [O iii ] λ λ \lambda\lambda 4959, 5007 doublet stays essentially constant, confirming [O iii ] as a stable internal flux reference. Vertical dashed lines mark the H β \beta (4800–4929 Å) and [O iii ] (4929–5040 Å) windows.
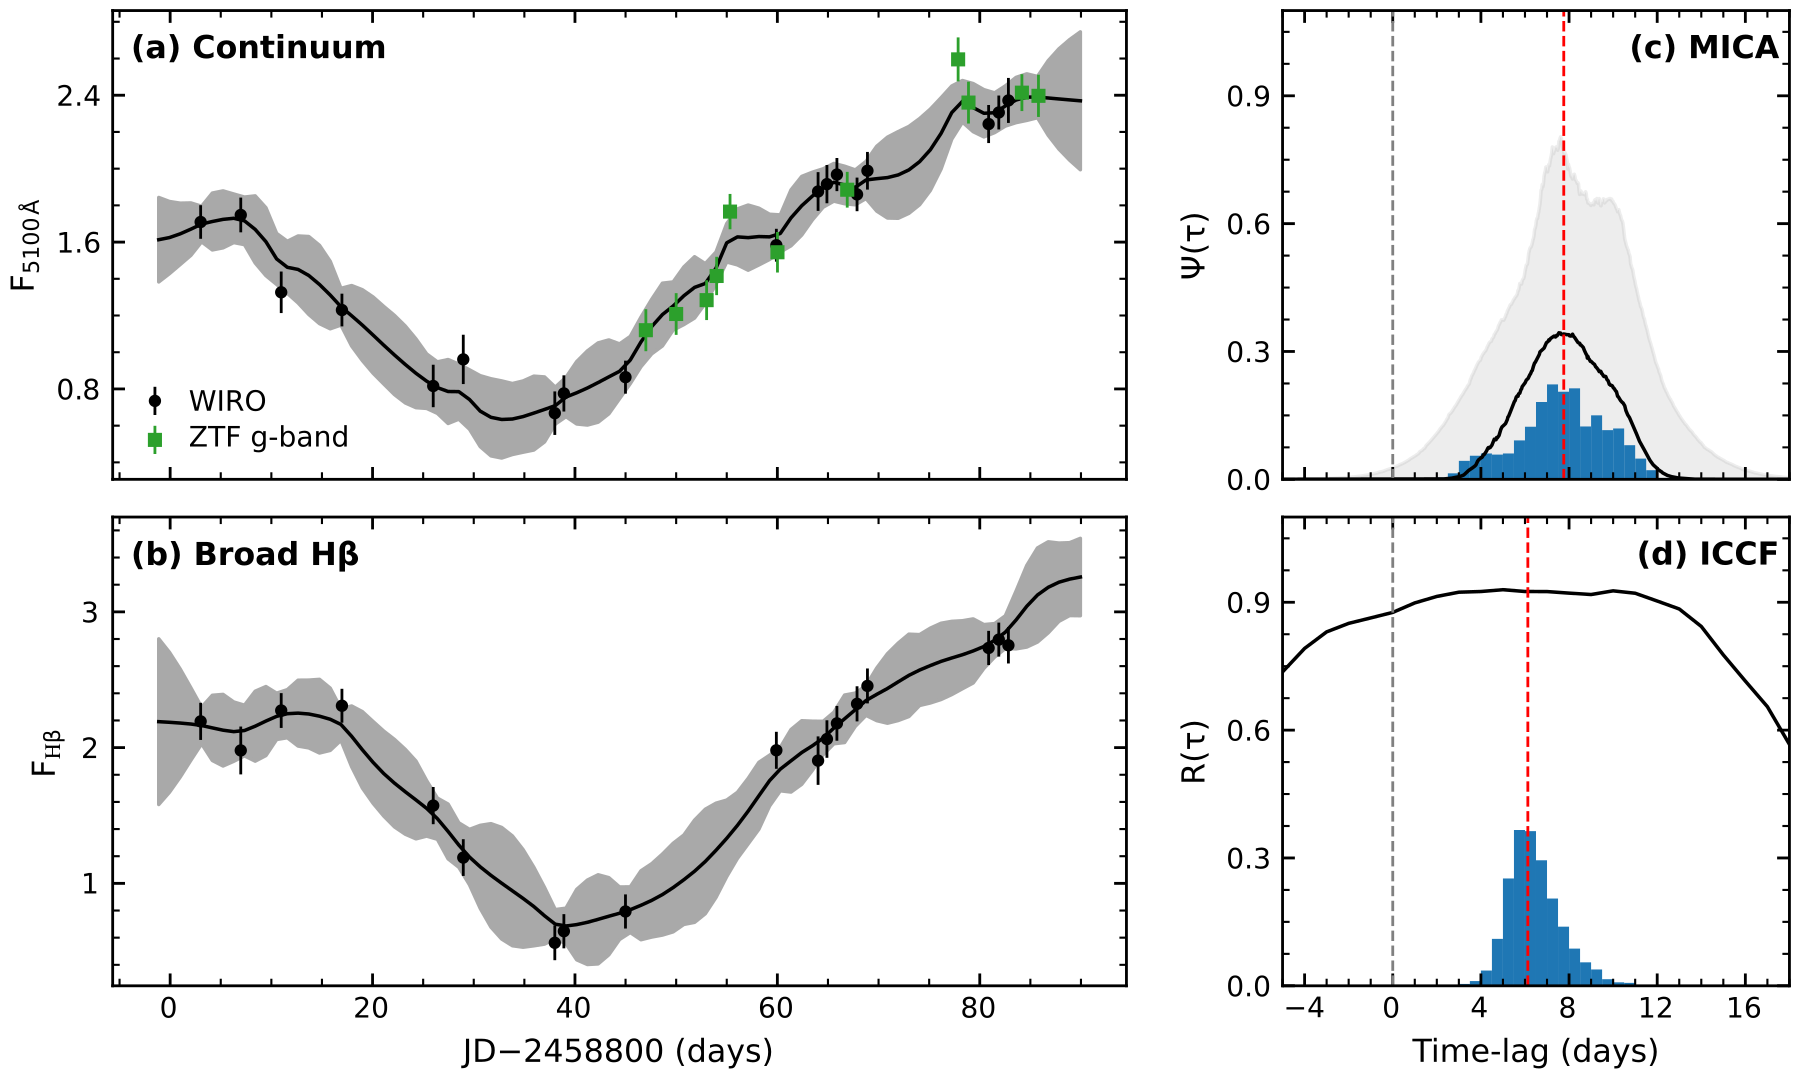
Tests the dim-phase reverberation signal. MICA reconstructs the 5100 Å and broad-Hβ light curves and supplies a lag posterior; ICCF supplies an independent centroid distribution. Their captioned medians are ∼7.7 and ∼6 days, respectively.
Original caption
Figure 4: Time-lag analysis of the continuum and broad H β \beta emission during the obscuration phase. Panels (a) and (b) show the observed (points) and MICA-reconstructed light curves of the rest-frame 5100 Å continuum and the broad H β \beta emission, in units of 10 − 14 10^{-14} erg cm -2 s -1 Å -1 and 10 − 12 10^{-12} erg cm -2 s -1 , respectively. Solid black curves trace the median reconstructed light curve and gray bands show its 1 σ 1\sigma uncertainty. The 5100 Å continuum in panel (a) is supplemented with the inter-calibrated ZTF g g -band photometry (green points). Panel (c) shows the MICA lag posterior distribution (histogram); the solid black curve is the median reconstructed transfer function and the gray band marks its 1 σ 1\sigma uncertainty. Panel (d) shows the ICCF centroid distribution (histogram) together with the cross-correlation function (solid black curve). Vertical red dashed lines mark the median lag values. The MICA lag posterior distribution has a median of ∼ \sim 7.7 d, while the ICCF centroid distribution has a median value of ∼ \sim 6 d.
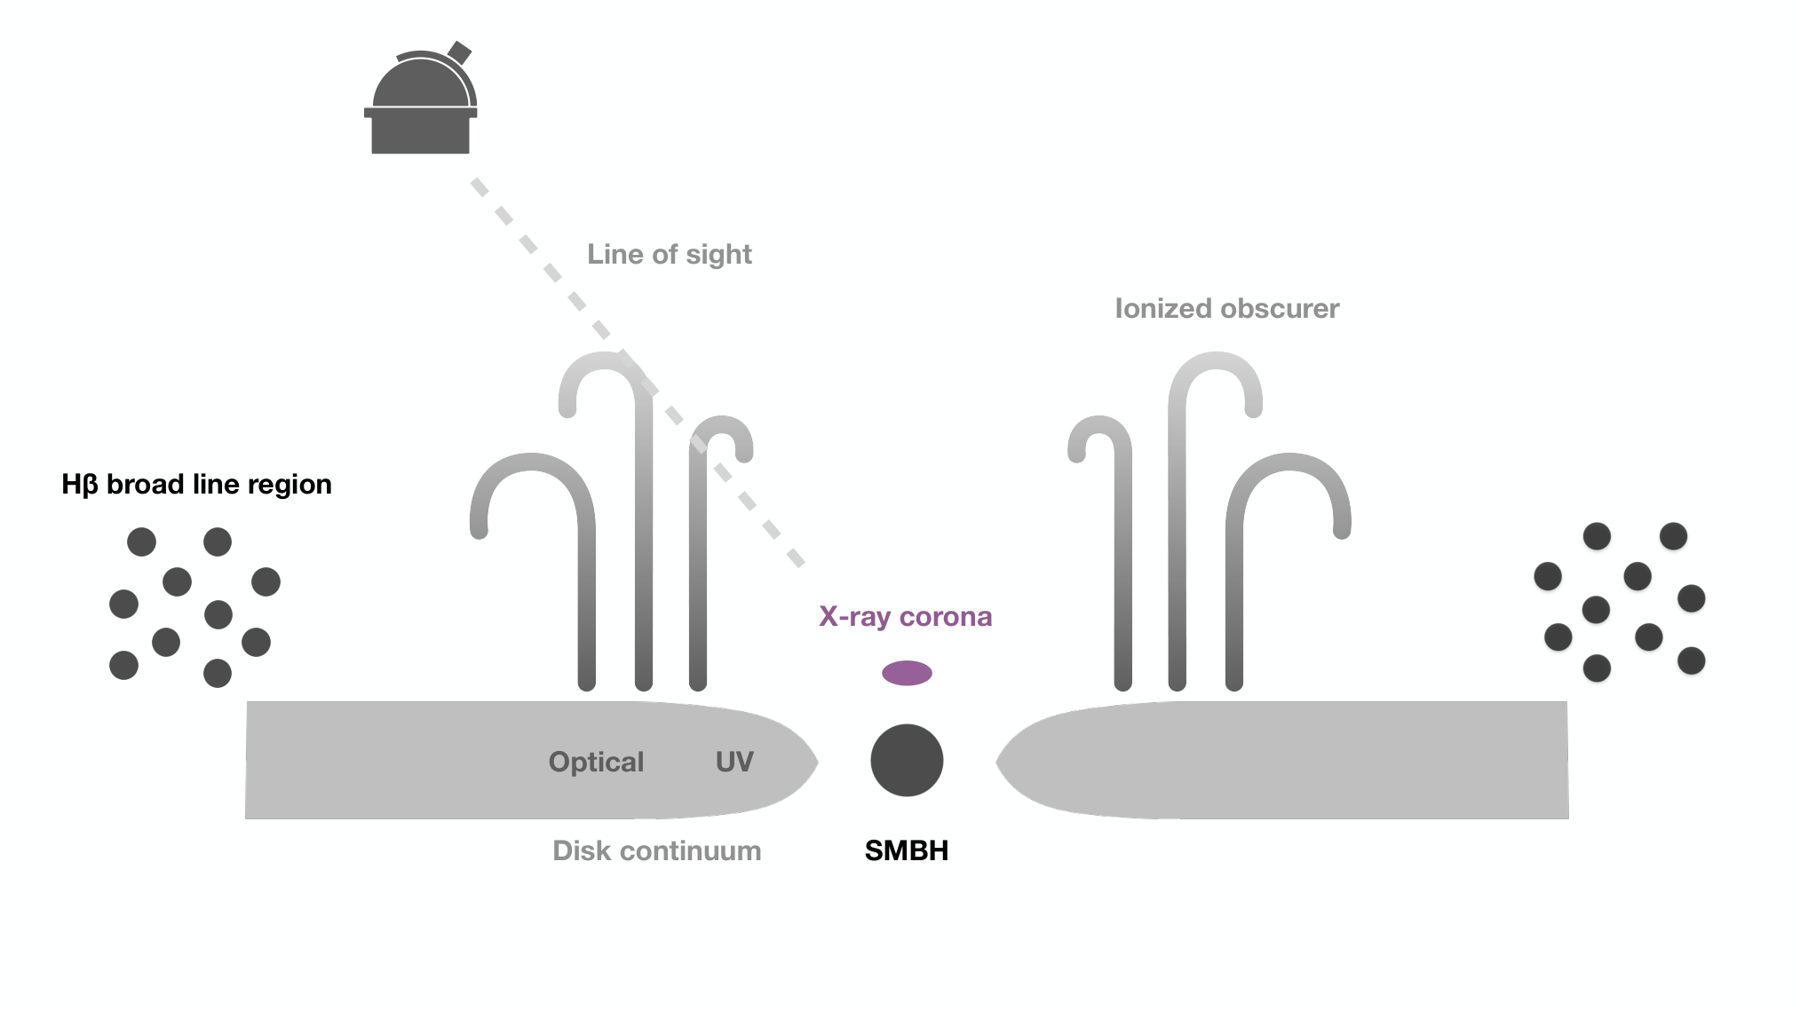
Summarizes, rather than independently tests, the proposed geometry: a dense Compton-thick structure interior to the BLR attenuates both the observed optical continuum and the ionizing continuum incident on the BLR.
Original caption
Figure 6: Schematic illustration of the proposed obscuration geometry in NGC 3227. A dense, Compton-thick obscuring structure located interior to the BLR rises above the accretion disk, blocking the ionizing continuum before it reaches the BLR while also attenuating the observed 5100 Å optical continuum along our line of sight.
Related research
Previous digest
Zhang et al. report an unusually rapid changing-look episode in the nearby Seyfert NGC 3227, where the optical continuum fell by more than 70% and broad Hβ nearly vanished within weeks before recovering within two months. WIRO spectroscopy, ZTF photometry, and Swift monitoring show that the optical dimming coincided with X-ray spectral hardening, while damped-random-walk simulations find such a decline unlikely to arise from normal stochastic accretion variability (p = 0.002). Crucially, Hβ continued to reverberate with a 6–8 day lag during the dim phase, placing the obscurer inside the broad-line region; photoionization modeling requires a fully ionized, Compton-thick column of roughly NH = 1.5 × 10^24 cm^-2. The event provides direct evidence that compact inner obscurers can drive extreme optical changing-look behavior on week timescales without destroying the BLR.
Sources and evidence (26)
- 2610.29137v1: NGC 3227 Blinks: An Extreme Changing-Look Event in a Seyfert Galaxy
We report a rapid optical changing-look event in the Seyfert galaxy NGC 3227: the optical continuum faded by more than 70% and broad H-beta emission nearly disappeared within weeks, before recovering within two months. Damped random walk simulations calibrated to the source's normal variability show that such a decline is unlikely for stochastic accretion fluctuations (p = 0.002). Simultaneous Swift monitoring reveals X-ray spectral hardening, pointing to enhanced line-of-sight absorption. During the dim state, reverberation mapping yields a persistent 6-8 day lag between the continuum and broad H-beta, showing that the broad-line region continued to reverberate and placing the obscurer interior to the broad-line region. Photoionization calculations require a fully ionized, Compton-thick column with N_H ~ 1.5 x 10^24 cm^-2 to reproduce the optical continuum suppression. Together, these observations demonstrate that compact, high-column-density obscurers interior to the broad-line region can produce extreme optical changing-look behavior on week timescales.
- 2610.29137v1: NGC 3227 Blinks: An Extreme Changing-Look Event in a Seyfert Galaxy
The detection of a coherent reverberation lag between the continuum and broad H β \beta during the obscuration phase localizes the obscuring material: the H β \beta decline is the BLR’s light-travel response to an attenuated ionizing continuum, not a direct extinction of the line-emitting gas along our sightline, so the BLR continues to reprocess the continuum it receives. This excludes obscuration exterior to the BLR. Such an obscurer dims H β \beta only by attenuating the line emission, so suppressing the broad H β \beta flux by ∼ \sim 80% requires it to cover most of the spatially extended BLR — a structure comparable in scale to the BLR itself. If the obscurer covers the continuum source and BLR simultaneously (for example, an in-situ rise in opacity along the sightline), the two decline together, producing correlated, zero-lag drops.
- 2610.29137v1: NGC 3227 Blinks: An Extreme Changing-Look Event in a Seyfert Galaxy
We have presented high-cadence optical spectroscopic monitoring of an extreme changing-look event in NGC 3227 and shown that: (1) the 5100 Å continuum and broad H β \beta flux fell by ∼ \sim 70% and ∼ \sim 80% and recovered within two months, a decline that damped random walk simulations disfavor as stochastic accretion variability ( p = 0.002 p=0.002 ) and that coincides with Swift X-ray hardening; (2) a persistent 6–8 day continuum-to-H β \beta lag through the dim state shows the broad-line region still reverberates, placing the obscurer interior to the BLR; and (3) reproducing the optical suppression requires a fully ionized, Compton-thick column, N H ≃ 1.5 × 10 24 N_{\rm H}\simeq 1.5\times 10^{24} cm -2 . Together these establish that compact, high-column-density obscuration interior to the BLR can drive an extreme optical changing-look event on week timescales. Such events are hard to characterize from either band alone — X-ray and UV data fix the absorber’s column and ionization state, high-cadence optical spectroscopy localizes it through reverberation mapping — so simultaneous coverage is needed to constrain the obscurer’s geometry. Wide-field time-domain surveys with the Rubin Observatory should uncover many more and motivate the coordinated follow-up such events require.
- 2610.29137v1: NGC 3227 Blinks: An Extreme Changing-Look Event in a Seyfert Galaxy
These transitions are generally attributed to two distinct physical mechanisms [ 41 ] . In the first case, changes in the intrinsic accretion flow onto the supermassive black hole (SMBH) lead to the strengthening or weakening of the ionizing continuum, resulting in the appearance or disappearance of broad emission lines [ 43 , 18 ] . In the second, known as changing obscuration, variations in the line-of-sight column density modulate the observed emission, producing pronounced spectral changes [ 42 , 49 ] . Such obscuration-driven events display X-ray spectral hardening, often accompanied by suppressed soft X-ray emission and, in some cases, blue-shifted broad absorption-line troughs in the ultraviolet [ 26 , 23 ] .
- 2610.29137v1: NGC 3227 Blinks: An Extreme Changing-Look Event in a Seyfert Galaxy
To improve coverage during the obscuration phase, we augmented the 5100 Å continuum with inter-calibrated ZTF data, as sparse sampling degrades both ICCF and MICA results more than the modest systematics introduced by inter-calibration. In contrast, ZTF data were excluded from the normal phase to preserve the homogeneity and precision of our primary dataset, though including the inter-calibrated ZTF data in the normal phase yields an essentially identical lag. ICCF and MICA analyses were performed independently for each phase, enabling a direct comparison of the delay behavior.
- 2610.29137v1: NGC 3227 Blinks: An Extreme Changing-Look Event in a Seyfert Galaxy
If instead the obscurer transits the system, it occults the continuum source and the surrounding BLR at different times and smears the H β \beta decline over the crossing — in neither case reproducing the coherent ∼ \sim 6–8 day delay we observe. A well-defined positive lag, in which the entire H β \beta light curve follows the continuum after a fixed delay, is instead the signature of light-travel reprocessing and requires the obscurer to lie interior to the BLR, where it attenuates the continuum before it reaches the line-emitting gas. This inner location is consistent with the X-ray analysis of the 2019 event by Mao et al. [31] , and with this system’s earlier X-ray occultations, whose absorbing clouds were also placed within or at the inner edge of the BLR [ 50 , 3 ] .
- 2610.29137v1: NGC 3227 Blinks: An Extreme Changing-Look Event in a Seyfert Galaxy
Photoionization modeling further shows that reproducing the observed attenuation of the 5100 Å continuum requires a fully ionized Compton-thick column density of N H ∼ 1.5 × 10 24 N_{\rm H}\sim 1.5\times 10^{24} cm -2 along the line of sight. Such a large column density is qualitatively consistent with the pronounced soft X-ray suppression and X-ray spectral hardening observed at the onset of this event, although the X-ray-derived column density is one to two orders of magnitude lower. This difference likely reflects both temporal and geometric factors: the X-ray column was likely still evolving when last measured, increasing from ∼ 10 22 \sim 10^{22} to ∼ 10 23 \sim 10^{23} cm -2 over the weeks before the optical minimum [ 31 ] , and no X-ray observation samples the epoch of deepest optical suppression (2019 December 19, both later and deeper than the final X-ray epoch), precluding a direct comparison at the same evolutionary stage. Furthermore, the X-ray column density traces a narrow sightline to the compact corona, whereas the optical continuum sees a sightline to the continuum source at a larger radius, where the obscurer’s column density may differ.
- 2610.29137v1: NGC 3227 Blinks: An Extreme Changing-Look Event in a Seyfert Galaxy
To illustrate the observational results, we present a proposed obscuration geometry in Figure 6 , which is similar to that previously offered for Mrk 817 [ 24 ] , where a comparable inner obscurer left the broad UV lines decoupled from the observed continuum (a “holiday”; Homayouni et al. 20 ). In NGC 3227 the covering instead suppresses the continuum reaching the H β \beta -emitting BLR, producing a full H β \beta changing-look event. Unlike the Mrk 817 holiday, however, the persistent ∼ \sim 6–8 day lag shows that H β \beta still reverberates in response to the attenuated continuum. The physical nature of the obscurer — whether a disk wind or another circumnuclear structure — cannot be determined from the present data and remains an open question. We note, however, that a time-dependent, line-driven accretion-disk wind is one plausible candidate: simulations show that such winds can become Compton-thick along equatorial sightlines [ 40 , 39 ] .
- 2610.29137v1: NGC 3227 Blinks: An Extreme Changing-Look Event in a Seyfert Galaxy
The event in NGC 3227 is currently unique in exhibiting X-ray obscuration accompanied by an optical changing-look transition, in which the broad emission lines nearly vanished alongside the continuum. In contrast, most X-ray changing-obscuration events do not show a clear correlation between the X-ray and UV/optical changing-look behavior. Certain X-ray changing-obscuration events (e.g., Mrk 817 and NGC 5548) instead exhibit (a) blueshifted absorption-line troughs rather than the near-complete continuum and emission-line suppression observed here, and (b) a BLR “holiday,” in which the broad lines decouple from the ionizing-continuum variability [ 15 , 7 , 24 , 20 ] . Such holidays may depend on the obscurer’s column density ( N H N_{\rm H} ): if the material is transparent to specific bands of the spectral energy distribution, only partial suppression occurs. Because Compton-thick, near-total-coverage obscuration events are likely far rarer than ordinary obscuration, NGC 3227 remains the only unambiguous case identified to date.
- 2610.29137v1: NGC 3227 Blinks: An Extreme Changing-Look Event in a Seyfert Galaxy
Figure 6: Schematic illustration of the proposed obscuration geometry in NGC 3227. A dense, Compton-thick obscuring structure located interior to the BLR rises above the accretion disk, blocking the ionizing continuum before it reaches the BLR while also attenuating the observed 5100 Å optical continuum along our line of sight.
- 2605.07965v1: A Changing-Look Seyfert Discovered by eROSITA Reveals a Two-Component Broad-Line Region
We deconvolved the broad H β \beta and H α \alpha profiles into two kinematic components. A broad Gaussian, with velocity widths σ \sigma typically 1800–3900 km s -1 (30–50 Å \AA ), dominated the spectra taken during the first six months after the continuum dip (January 2022 – June 2022); it is consistent with virialized gas at a radial distance of 27 ± \pm 3 lt-dy. The second component is double-peaked, and becomes more prominent in the total broad Balmer profiles starting one year after the continuum dip. It can be modeled as a diskline (flat annulus) with an inner radius of ∼ \sim 1000 R g R_{\rm g} , or 5 lt-dy. The fractional contribution of the diskline to the total profile, F DL F_{\rm DL} , increases as UV flux and m ˙ Edd \dot{m}_{\rm Edd} increase during our campaign. One possible explanation is that the diskline component has a low scale height, but as m ˙ Edd \dot{m}_{\rm Edd} increases, there is an increase in the scale height and/or radial extent of the hot and/or in particular the warm X-ray-emitting coronae; the extreme variations in warm corona luminosity that we observe could qualitatively support this notion. This increase allows a larger fraction of > > 13.6 eV photons to be intercepted by the diskline component. One can speculate if the increase in scale height may be connected to the putative warm propagating front that may drive the increase in m ˙ Edd \dot{m}_{\rm Edd} . In the context of such propagating fronts, this change in scale height could provide a physical mechanism linking the change in accretion rate with the evolution in BLR illumination.
- 2605.07965v1: A Changing-Look Seyfert Discovered by eROSITA Reveals a Two-Component Broad-Line Region
The resulting SEDs are plotted in Fig. 3 ; the spectral variability, particularly in the optical/UV regime, is readily apparent. We fit a model consisting of fAGNSED ( Kubota & Done 2018 ; Hagen & Done 2023 ) plus an Sb host galaxy template from the SWIRE template library ( Polletta et al. 2007 ) to account for host galaxy starlight, with both components absorbed and reddened only by our Galaxy. For Galactic reddening, we set E ( B − V ) E(B-V) to 0.057, based on the dust maps of Schlegel et al. (1998) . fAGNSED posits three emission regions: an optically thick, geometrically thin outer disk that encircles a warm Comptonizing region, which in turn encircles a geometrically thick, optically thin, hot Comptonizing region. In all fits we froze the co-moving distance to the source at 404 Mpc, the normalization at unity, the black hole mass to 1.4 × 10 8 M ⊙ 1.4\times 10^{8}\hbox{$\rm\thinspace M_{\odot}$} , derived via the width of the broad H β \beta emission lines as discussed in Sect. 6.3 , the dimensionless black hole spin parameter a ∗ a* at zero, the electron temperature of the hot corona, k B T e , hot k_{\rm B}T_{\rm e,hot} , at 100 keV, the hot corona’s scale height at 10 R g R_{\rm g} , and the inclination angle of the warm corona and outer disk at 15 ∘ 15^{\rm\circ} . In addition, we kept the radial size of the warm corona, R warm R_{\rm warm} , fixed to twice that of the hot corona, R hot R_{\rm hot} , in all fits. The outer radius of the disk was calculated via the self-gravity radius from Laor & Netzer (1989) , and reprocessing was included. Compared to AGNSED , fAGNSED includes a color–temperature correction for the accretion disk emission, f col f_{\rm col} , which we left as a free parameter. For the XM1–3 fits, which had the best signal-to-noise ratio, the free parameters were the accretion rate relative to Eddington, m ˙ Edd \dot{m}_{\rm Edd} , the electron temperature of the warm corona, k B T e , warm k_{\rm B}T_{\rm e,warm} , the spectral indices of the warm ( Γ warm \Gamma_{\rm warm} ) and hot ( Γ hot \Gamma_{\rm hot} ) Comptonization components, the outer radius of the hot Comptonizing component, R hot R_{\rm hot} , and the normalizat
- 2606.18155v1: X-ray eclipse tomography: Resolving the extent of X-ray-emitting region(s) in the Seyfert galaxy ESO362-G18
X-ray spectral variability in active galactic nuclei (AGNs) can be either intrinsic or caused by external processes, such as variable absorption. Several transient occultation events from individual clouds or X-ray eclipses have been identified in a number of AGNs in the past two decades. We report results from the analysis of two Swift monitoring campaigns of the Seyfert galaxy ESO 362-G18, a changing-look AGN that showed transitions between optical spectral types 1.5 and 1.9 in the past, most likely induced by variable absorption. We identified two X-ray eclipses during the first Swift campaign, one of which we were able to follow almost entirely from ingress to egress. We used time-resolved spectroscopy to follow the evolution of the X-ray spectrum with time in order to derive the properties of the absorbing cloud and the size of the main X-ray-emitting region. The cloud is located towards the innermost dust sublimation zone, intermediate between the dust-free broad-line region and the dusty torus. The X-ray-emitting region is confined within ∼ 35 \sim 35 gravitational radii ( R g R_{g} ) from the centre. A deeper analysis indicated that the eclipsing cloud likely comprises a denser core and a more tenuous atmosphere. We were also able to estimate the size of the soft excess and hot corona X-ray-emitting regions separately. These are two of the most relevant continuum components in the X-ray spectra of unobscured AGNs. Our analysis suggests that the soft-excess-emitting region is ∼ 50 \sim 50 % more extended than the hot corona one. However, it appears to co-exist with and is not replaced by the hot corona one in the innermost ∼ 30 R g \sim 30\penalty\ R_{\rm g} . Our results highlight the potential of X-ray eclipse tomography for providing a clearer view of the innermost accretion flow geometry and of the AGN surroundings out to the torus scale.
- 2606.18155v1: X-ray eclipse tomography: Resolving the extent of X-ray-emitting region(s) in the Seyfert galaxy ESO362-G18
Our results suggest that the soft-excess-emitting region is about 50 50 % more extended than the hot corona, although with relatively large uncertainties. In Table 4 , the asymmetric uncertainties on r atm r_{\rm atm} and r SE r_{\rm SE} reflect the conditions r atm > r core r_{\rm atm}>r_{\rm core} (by definition of a structured cloud) and r SE > r HC r_{\rm SE}>r_{\rm HC} (to prevent C f , max ( SE ) > C f , max ( HC ) C_{\rm f,max}^{\rm(SE)}>C_{\rm f,max}^{\rm(HC)} at maximum coverage by the cloud core, which is not observed).
- 2609.30441v1: A tidal disruption event in a quasar at redshift 7.19
Table 1: Summary of available photometric data of GNz7q used in this study
- 2609.30441v1: A tidal disruption event in a quasar at redshift 7.19
Figure 9 shows the resulting normalized light curves for these comparison sources, including only measurements with S / N > 3 {\rm S/N}>3 . None of the control objects exhibits statistically significant long-term or wavelength-dependent variability comparable to that observed in GNz7q. The absence of correlated variability in these sources demonstrates that the observed behavior of GNz7q cannot be attributed to instrumental differences, filter-response mismatches, PSF variations, or details of the photometric extraction, and instead reflects genuine intrinsic variability of the source.
- 2501.12449v1: Intervening nuclear obscuration changing the X-ray look of the $z\approx6$ QSO CFHQS J164121+375520
Considering the three epochs of the Chandra monitoring program individually, J1641 was not detected in any of them in the soft band, while it was detected in the hard and full band in the 2022 epoch only (Tab. 1 ) with significance ( 1 − P B ) = 0.9996 (1-P_{B})=0.9996 and 0.9975 0.9975 , respectively. The significance of the hard-band and full-band detections increases to 0.9998 0.9998 and 0.9999 0.9999 , respectively, when stacking the three epochs, while no significant counterpart is detected in the soft band. We estimate the spectral properties of J1641 from this stacked dataset by considering the hardness ratio H R = H − S H + S HR=\frac{H-S}{H+S} , where H and S are the net counts in the hard and soft bands, respectively. Following the method used in 54 , we obtain H R > − 0.04 HR>-0.04 , that, assuming simple power-law emission, accounting for the Galactic absorption ( Kalberla et al., 2005 ) , and using the merged Chandra response files at the position of J1641, corresponds to an effective photon index Γ < 0.4 \Gamma<0.4 . 4 4 4 We used XSPEC v.12.13 ( Arnaud, 1996 ) for these calculations. This value is much flatter than the photon index obtained from spectral analysis in 2018 (i.e., Γ = 2.4 ± 0.5 \Gamma=2.4\pm 0.5 ), and suggests that the soft-band emission became heavily absorbed.
- 2501.12449v1: Intervening nuclear obscuration changing the X-ray look of the $z\approx6$ QSO CFHQS J164121+375520
To estimate the obscuration level, we fixed Γ = 2 \Gamma=2 and added to our assumed spectral model an absorption component (i.e., model pha*zpha*pow in XSPEC). The lower limit on the hardness ratio translates into a column density log N H cm − 2 > 24.2 \frac{N_{H}}{\mathrm{cm^{-2}}}>24.2 . Similar values are obtained by assuming the photon index measured in 2018 or the more physically motivated MYTorus model ( Murphy & Yaqoob, 2009 ) . Tab. 1 reports the flux of J1641 estimated assuming this column density. The corresponding absorption-corrected, rest-frame 2–10 keV luminosity is L X = 7.7 − 4.2 + 4.2 × 10 44 erg s − 1 L_{X}=7.7^{+4.2}_{-4.2}\times 10^{44}\,\mathrm{erg\,s^{-1}} . This value is lower than the luminosity measured for the 2018 dataset (i.e., 33.4 − 5.1 + 5.6 × 10 44 erg s − 1 33.4^{+5.6}_{-5.1}\times 10^{44}\,\mathrm{erg\,s^{-1}} ), but it should be treated as a lower limit, as we assumed the lower limit on N H N_{H} estimated above for the absorption correction.
- 2605.05301v1: An X-ray and optical spectral study of the changing-look narrow-line Seyfert 1 2MASX J0413-0050
The main Balmer lines, H α \alpha and H β \beta , both show narrow and broad components, indicating an unobscured view of the central engine. The broad components resulted to have a FWHM of 3675 km s -1 while the narrow components of 741 km s -1 (Tab. 2 ). The integrated fluxes for the single components are reported in Tab. 2 . Despite the H α \alpha -[N II] complex not being completely resolved, due to poor spectral resolution, fantasy could decompose the H α \alpha contribution from the [N II] doublet.
- 2605.05301v1: An X-ray and optical spectral study of the changing-look narrow-line Seyfert 1 2MASX J0413-0050
Finally, the exceptionality of this source lies in its CL transition happening at high Eddington ratios, compared to the typical CL behaviour outlined in the Sect. 1 . However, recent results suggest that the threshold for such events can reach as low as 1 % \% of the Eddington ratio ( Jana et al. 2025 , , and references therein) .
- 2502.07875v1: Investigating photometric and spectroscopic variability in the multiply-imaged Little Red Dot A2744-QSO1
A&A proofs: manuscript no. main Table 3. JWST/NIRSpec emission line results for each image of A2744- QSO1 in each epoch of available spectroscopy (see Tab. 2). The line fluxes and underlying continuum flux densities are de-magnified, but the EWs are independent of magnification. Line Image A Image B Image C Epoch 7 Epoch 8 EW0 [Å] Hβ 48+2 −2 53+4 −4 50+2 −2 62+5 −5 Hα 285+7 −6 289+9 −8 307+4 −5 346+11 −11 Fline [10−19 erg cm−2 s−1] Hβ 2.7 ± 0.2 2.9 ± 0.3 2.4 ± 0.3 2.9 ± 0.3 Hα 20.2 ± 0.8 24.7 ± 1.1 18.3 ± 1.4 24.7 ± 1.1 fλ,continuum [10−22 erg cm−2 s−1 Å−1] Hβ 6.9 ± 0.3 6.7 ± 0.3 5.6 ± 0.2 4.8 ± 0.4 Hα 8.8 ± 0.3 10.6 ± 0.4 6.7 ± 0.2 6.6 ± 0.5 −800 −600 −400 −200 0 200 ∆t0 [d] 45 50 55 60 65 70 EW0 [˚A] Image A – Hβ Image B – Hβ Image C – Hβ −6000 −4000 −2000 0 2000 ∆tobs [d] 280 300 320 340 360 EW0 [˚A] Image A – Hα Image B – Hα Image C – Hα Fig. 2. Spectroscopic variability of A2744-QSO1 as a function of time, with image A shown in blue, image B in red, and image C in green as in Fig. 3. –Top: Hβ rest-frame EW, presenting a drop of 22 ± 8 % between images C and A. –Bottom: Hα rest-frame EW, presenting a drop of 18± 3 % in the time between images C and A. We note that the variability is consistent in both broad Balmer lines, as can be expected since they both originate from the broad-line region of A2744-QSO1. The EWs represent excellent indicators of variability since they are insensitive to most systematics such as lensing, slit-losses, calibration, etc. absolute line fluxes, the EWs are neither prone to lensing nor instrumental systematics (e.g. slit-losses), which is why we use them as the primary and most robust indicators of variability (see also Ji et al. 2025). As can be seen in Fig. 2, both Hα and Hβ show a consistent variability in their EW over time2. More quan- titatively, we note a drop in EW of 18 ± 3 % in Hα and 22 ± 8 % in Hβ between the times probed by image C and image A (in both its epochs). The absolute calibration of the red edge of the 2 Here and throughout this letter, we define the time axis in days rel- ative to the UNCOVER imaging (epoch 2 at MJD = 59890.23, see Tab. 2). The relative time is then obtained by adding the difference be- tw
- 2502.07875v1: Investigating photometric and spectroscopic variability in the multiply-imaged Little Red Dot A2744-QSO1
tics estimated for these magnification values can reach ∼40 % (Zitrin et al. 2015). However, the exact level does not affect the conclusions of this work. Article number, page 3 of 11
- 2606.10455v1: The Extreme Quasar Main Sequence of Super-Eddington DESI-DR1 NLSy1 Galaxies
Results. The DESI-DR1 NLSy1 population shows a striking shift toward the extreme end of the EV1 parameter space, possessing stronger Fe II emission (median log R 4570 = − 0.03 \log R_{4570}=-0.03 ) compared to the SDSS sample ( − 0.31 -0.31 ). Furthermore, the DESI sources systematically harbor less massive black holes (median log M BH / M ⊙ ≈ 6.73 \log M_{\text{BH}}/M_{\odot}\approx 6.73 in both calibrations) than the SDSS objects ( 6.77 − 6.91 6.77-6.91 ). Given their comparable continuum luminosities, a consistently larger fraction of the DESI sample (43.8%–47.7%) is pushed across the Eddington limit ( log R E d d > 0 \log R_{Edd}>0 ) compared to the SDSS sample (20.6%–37.4%).
- 2606.10455v1: The Extreme Quasar Main Sequence of Super-Eddington DESI-DR1 NLSy1 Galaxies
In this work, we have utilized the unprecedented sensitivity of the DESI-DR1 survey to identify and characterize a new, large sample of 18,749 Narrow-Line Seyfert 1 galaxies ( DESI Collaboration, 2025 ) . By projecting this sample onto the EV1 parameter space and comparing it against the SDSS-DR17 NLSy1 population ( Paliya et al., 2024 ) , we reach the following conclusions: (1) The DESI-DR1 survey has uncovered a distinct, extreme tail of the quasar main sequence. The DESI-NLSy1 galaxies show stronger Fe II emission (median log R 4570 = − 0.03 ± 0.52 \log R_{4570}=-0.03\pm 0.52 ) compared to previously known SDSS-NLSy1s (median log R 4570 = − 0.31 ± 0.29 \log R_{4570}=-0.31\pm 0.29 ). (2) This EV1 shift is likely to be driven by a population of lower-mass supermassive black holes. The median single-epoch virial mass for the DESI sample is log ( M BH / M ⊙ ) = 6.73 ± 0.42 \log(M_{\text{BH}}/M_{\odot})=6.73\pm 0.42 , significantly lower than the SDSS sample ( log ( M BH / M ⊙ ) = 6.91 ± 0.37 \log(M_{\text{BH}}/M_{\odot})=6.91\pm 0.37 ). (3) Coupling their lower black hole masses with their continuum luminosities reveals that a substantial fraction of the DESI-NLSy1 population (43.8%, compared to 20.6% for SDSS) is accreting at or above the Eddington limit. Although applying the Eddington-dependent Woo et al. (2026) calibration reduces the gap between the two samples (47.7% vs. 37.4%), the overall trend remains consistent, robustly confirming their extreme accretion states.
- 2607.28715v1: Misaligned or chaotic? A strong break of axial symmetry in the local LRD J1025 revealed with VLT/FORS2 spectropolarimetry
Within the Madau and Maiolino (2026) model, the favoured BLR polarisation mechanism for J1025 is dichroic transmission (Section 4.5 ), whose efficiency is achromatic across the line and therefore implies identical p × I p\times I and I I widths. This is consistent with our results, although, as mentioned in Section 4.6.1 , we cannot consider this as a decisive proof in favour of one particular broadening mechanism.
- 2607.28715v1: Misaligned or chaotic? A strong break of axial symmetry in the local LRD J1025 revealed with VLT/FORS2 spectropolarimetry
We have presented VLT/FORS2 optical linear spectropolarimetry of the local Little Red Dot J1025 z ≃ 0.1 z\simeq 0.1 ; ‘Lord of LRDs’, Ji et al., 2026b ; ‘The Egg’, Lin et al., 2026 , spanning rest-frame ∼ 5300 – 6650 Å \sim 5300\text{--}6650~\text{\AA} .
Abstract
We report a rapid optical changing-look event in the Seyfert galaxy NGC 3227: the optical continuum faded by more than 70% and broad H-beta emission nearly disappeared within weeks, before recovering within two months. Damped random walk simulations calibrated to the source's normal variability show that such a decline is unlikely for stochastic accretion fluctuations (p = 0.002). Simultaneous Swift monitoring reveals X-ray spectral hardening, pointing to enhanced line-of-sight absorption. During the dim state, reverberation mapping yields a persistent 6-8 day lag between the continuum and broad H-beta, showing that the broad-line region continued to reverberate and placing the obscurer interior to the broad-line region. Photoionization calculations require a fully ionized, Compton-thick column with N_H ~ 1.5 x 10^24 cm^-2 to reproduce the optical continuum suppression. Together, these observations demonstrate that compact, high-column-density obscurers interior to the broad-line region can produce extreme optical changing-look behavior on week timescales.
Discussion
Discussion access requires a security token. Register for the weekly digest.