2610.32430v1 · First listed 2026-10-26
Local Analogs of Little Red Dots: Clues to the X-ray Weakness
Einstein Probe observations of six z≈0.3 local LRD analogs find an X-weak subgroup whose stacked soft-X-ray constraints favor modest intrinsic coronal weakness plus Compton-thin absorption, rather than the specific unobscured super-Eddington or local Compton-thick geometries tested. [1][6]
Evidence
The pilot sample comprises six V-shaped, broad-line green-pea galaxies selected as local LRD analogs at z≈0.3. EP-FXT spectra were fitted in XSPEC with an absorbed AGN power law plus a host component; for X-weak objects, the analysis fixed NH=10^22 cm^-2 and photon index Γ=1.8 and fitted normalization, while higher-S/N X-normal sources allowed more freedom. Stacking three X-weak LLRDs produced a 3.3σ rest-frame 2–8 keV detection, driven chiefly by 2–3 keV photons; the 0.5–2 keV band was only 1.9σ. Their inferred 2-keV luminosities sit ≈0.65 dex below the unobscured-quasar L2keV–L2500 relation. Host-emission uncertainty was estimated to change nuclear results by <5%, but the fixed X-weak spectral assumptions remain model-dependent. The authors report consistency of the X-weak stack with current LRD limits and Balmer diagnostics for NH≈10^22–10^23 cm^-2 and Δαox≈−0.1 to −0.2. [10][3][6]
Earlier work
High-redshift LRD X-ray measurements are limited because Chandra generally samples harder rest-frame energies and has yielded tentative stacks or limits. A concrete comparison is the Chandra LRD stack of arXiv:2505.09669v1: after background subtraction it found 35±41 soft- and 33±66 hard-band net counts, hence non-detections and 3σ flux limits. In contrast, this work’s lower-redshift analog stack detects rest-frame 2–8 keV emission at 3.3σ and directly constrains the ≈2–3 keV range. The authors state that the resulting moderate deficit is compatible with the representative LRD stack and 95% of published individual LRD limits; it therefore does not establish that every LRD is comparably X-ray weak. [13][9][3]
What changes
The study uses local analogs as an observational lever: the authors state that comparable signal-to-noise requires roughly 10^3–10^4 less exposure than at high redshift. It separates the six targets into two X-normal sources—type-1-AGN-like in X-rays and optical variability—and an X-weak subset with redder continua and no detected optical variability. By combining the X-ray stack with Balmer decrement/break behavior, the paper argues that modest coronal weakness plus Compton-thin obscuration is the simplest joint description. This is an interpretation of the tested models, not a unique measurement of corona physics or absorber geometry. [1][2][6]
Limits and open questions
The inference rests on only three X-weak objects in the detection stack and a marginal soft-band signal. The authors explicitly cannot exclude absorbed super-Eddington spectra with stronger intrinsic X-ray output, or Compton-thick configurations with enhanced scattering or low-column leakage. Local analog status is also a selection assumption: V-shaped broad-line green peas need not reproduce all physical or selection properties of z≈4–8 LRDs. Deeper X-ray data and larger analog samples are needed to determine whether the two observed X-ray classes are representative. [3][6][1]
Assessment is based on the supplied abstract, selected HTML excerpts, and figure captions. Extracts support the sample size, spectral model choices, stack significance, and stated caveats, but not full target-by-target measurements, exposure table values, or fit uncertainties.
Key figures
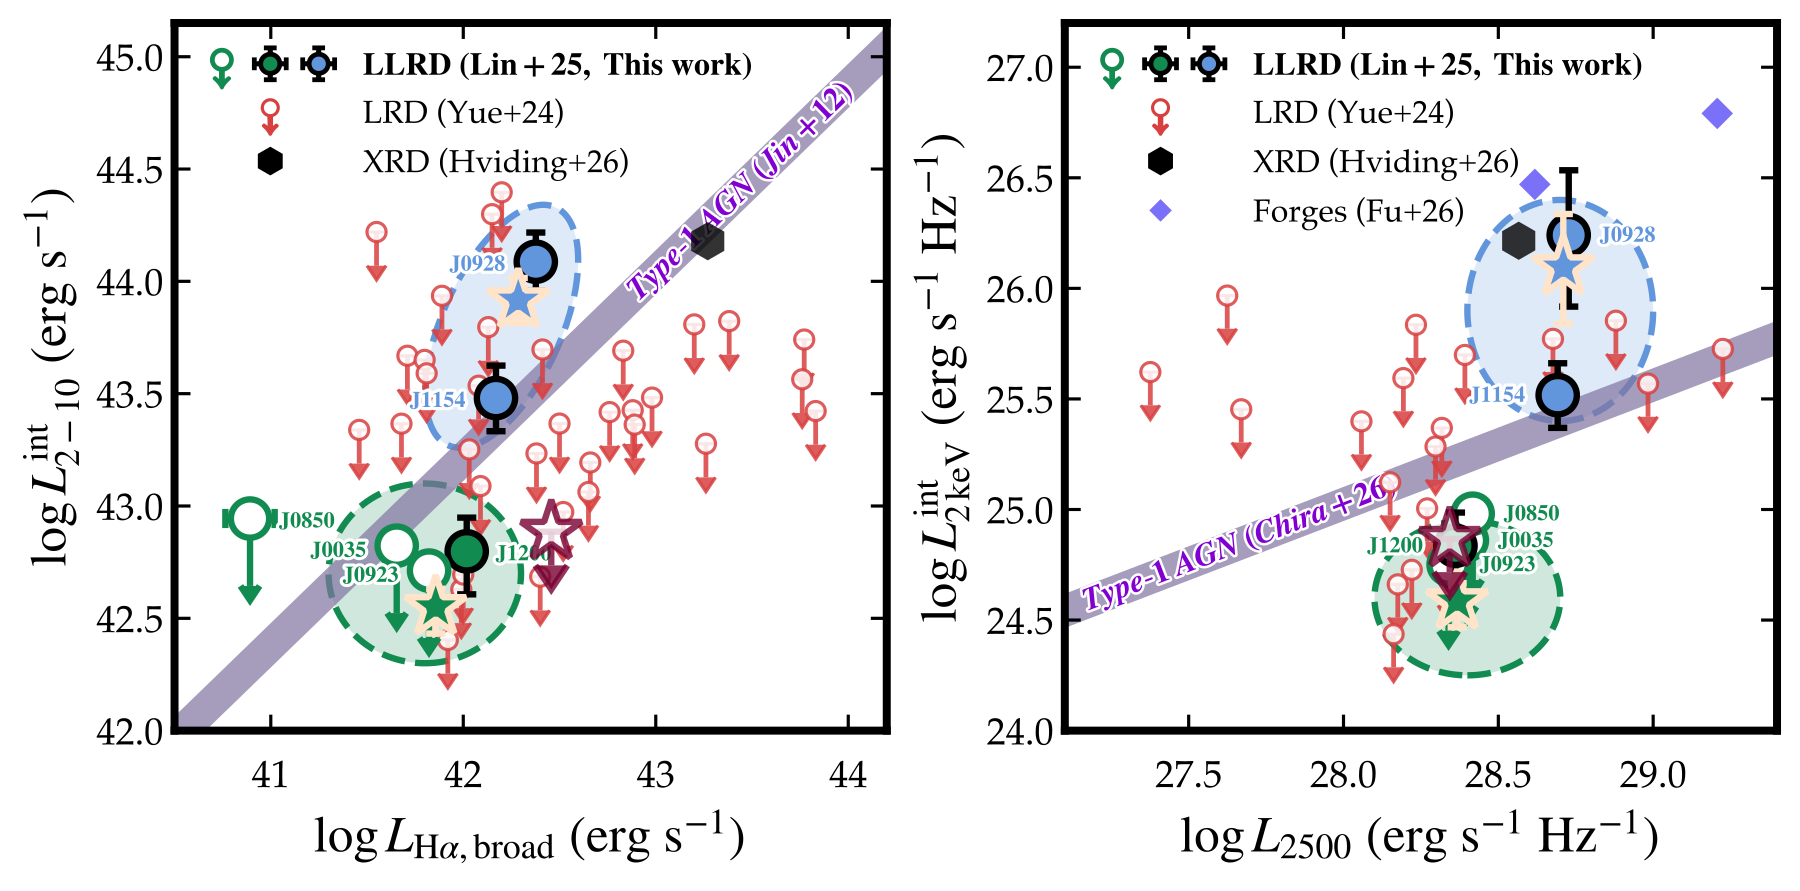
Tests whether individual and stacked LLRDs are X-ray normal or deficient relative to broad-Hα and UV quasar scaling relations, while placing them against published high-redshift LRD limits.
Original caption
Figure 2: Intrinsic X-ray emission of LLRDs benchmarked against AGNs and high-redshift LRDs. Left: 2 – 10 keV 210\text{\,}\mathrm{k}\mathrm{e}\mathrm{V} luminosity versus broad- H α \mathrm{H}\alpha luminosity; right: 2 keV 2\text{\,}\mathrm{k}\mathrm{e}\mathrm{V} monochromatic luminosity versus rest-frame 2500 Å 2500\text{\,}\AA luminosity. X-weak LLRDs are green (open circles: upper limits; filled circle: marginal J1200 detection), and X-normal LLRDs are blue; stars mark their spectral stacks, with dashed ellipses associating each stack with its members. Red circles and dark-red stars denote the individual and representative stacked 3 σ 3\sigma LRD limits based on Yue et al. [97] ; the stacked limits use exposure-weighted count-rate conversions and geometric-mean horizontal coordinates. Black and purple symbols show the XRD and Forges. Purple lines show the type 1 AGN relations.

Tests which normalized UV-to-X-ray SED/model combinations resemble X-weak and X-normal LLRDs versus stacked LRD constraints, including unobscured super-Eddington, Compton-thick, Compton-thin, and mildly X-ray-weak cases.
Original caption
Figure 3: Normalized IR–optical–UV–X-ray SEDs of the X-weak LLRDs (green), X-normal LLRDs (blue), and high-redshift LRDs (red). All SEDs are normalized at the rest-frame 2500 Å 2500\text{\,}\AA . The LLRD measurements combine EP-FXT X-ray spectroscopy with GALEX, SDSS, SPHEREx, and WISE photometry. The red measurements and background SED model show the stacked LRD constraints from Akins et al. [1] . The curves show a typical unobscured super-Eddington model with m ˙ = 1 \dot{m}=1 and M BH = 10 7 M ⊙ M_{\mathrm{BH}}=10^{7}\,M_{\odot} [ 41 ] ; a CT model with N H = 10 24.5 cm − 2 N_{\mathrm{H}}=10^{24.5}\,\mathrm{cm}^{-2} and Δ α ox = 0 \Delta\alpha_{\mathrm{ox}}=0 ; a Compton-thin model with N H = 10 23 cm − 2 N_{\mathrm{H}}=10^{23}\,\mathrm{cm}^{-2} and Δ α ox = − 0.10 \Delta\alpha_{\mathrm{ox}}=-0.10 ; the fitted X-weak LLRD model with N H = 10 22 cm − 2 N_{\mathrm{H}}=10^{22}\,\mathrm{cm}^{-2} and Δ α ox = − 0.25 \Delta\alpha_{\mathrm{ox}}=-0.25 ; and an unabsorbed local-AGN model with Δ α ox = 0 \Delta\alpha_{\mathrm{ox}}=0 .

Tests whether broad/narrow Balmer ratios and Balmer-break strength independently support the X-normal/X-weak split and columns in the moderate-obscuration regime.
Original caption
Figure 4: Balmer diagnostics support X-normal/weak division and moderate ( N H ∼ 10 22 − 23 cm − 2 N_{\mathrm{H}}\sim 10^{22-23}\,\mathrm{cm}^{-2} ) obscuration of X-weak LLRDs. Left: broad versus narrow H α \mathrm{H}\alpha / H β \mathrm{H}\beta . Right: Balmer-break strength versus broad H α \mathrm{H}\alpha / H β \mathrm{H}\beta . Red, green, and blue symbols denote LRDs from Chen et al. [19] , X-weak LLRDs, and X-normal LLRDs, respectively. Arrows indicate limits, diamonds mark representative LRD average, and gray symbols indicate Case B. Curves in the right panel show the dense-gas calculation from Yan et al. [93] : boxed labels identify N H N_{\mathrm{H}} for each track, while numbers along the tracks give n H n_{\mathrm{H}} in logarithm cm − 3 \mathrm{cm}^{-3} .
Related research
Previous digest
Chen et al. use Einstein Probe/FXT observations of six z~0.3 V-shaped broad-line green peas, selected as local little-red-dot analogs, to access the rest-frame soft X-rays that remain poorly constrained for JWST LRDs. The sample separates into X-normal objects with type-1-AGN-like X-ray emission and optical variability, and an X-weak subset whose ~3.3σ stack is 0.5-0.7 dex below unobscured-quasar relations while matching the representative LRD constraint; the X-weak sources are also optically redder and non-variable. Their soft-X-ray SED and Balmer diagnostics disfavor the specific unobscured super-Eddington and local-AGN-like Compton-thick geometries tested, favoring instead a mildly X-ray-weak corona plus Compton-thin absorption, NH~10^22-10^23 cm^-2, as a workable explanation for LRD-like X-ray weakness.
Sources and evidence (26)
- 2610.32430v1: Local Analogs of Little Red Dots: Clues to the X-ray Weakness
A major question about JWST's little red dots (LRDs) at $z\sim4-8$ is the origin of their apparent X-ray weakness. Even deep Chandra stacks yield only tentative detections or broad-band limits and cannot distinguish among super-Eddington accretion, intrinsic X-ray weakness, and Compton-thick (CT) obscuration. Local analogs offer a powerful complementary route. At $z\sim0.3$, similarly luminous sources require $\sim10^{3-4}$ less exposure for comparable signal-to-noise, suffer less source confusion, and directly probe the diagnostic rest-frame soft X-rays. Here we present a pilot Einstein Probe/FXT study of six "local little red dots" (LLRDs), V-shaped broad-line green pea galaxies selected as low-redshift counterparts of LRDs. These sources show X-ray diversity: "X-normal" LLRDs resemble type 1 AGNs in X-ray luminosity and optical variability, whereas the "X-weak" stack lies $\sim0.5-0.7$ dex below standard unobscured-quasar scaling relations while remaining compatible with the representative LRD stack and 95% of published individual limits. The X-weak LLRDs also lack detected optical variability and have redder optical continua than X-normal LLRDs, making their V-shaped SEDs closer to those of high-redshift LRDs. The detection of the X-weak stack at $\sim3.3σ$ with the soft-X-ray-sensitive EP-FXT provides rest-frame $\sim2-3$ keV constraints difficult to reconcile with a typical unobscured super-Eddington model or a local-AGN-like CT geometry examined here, although modified variants remain possible. The simplest alternative is a mildly X-ray-weak corona ($Δα_{\mathrm{ox}}\sim-0.1$ to $-0.2$) with Compton-thin absorption ($N_{\mathrm{H}}\sim10^{22-23}$ cm$^{-2}$), consistent with the independent Balmer decrement/break diagnostics. Together with growing samples of local LRD analogs, our results offer a practical path for testing the physical nature of LRD X-ray weakness.
- 2610.32430v1: Local Analogs of Little Red Dots: Clues to the X-ray Weakness
Targeted EP-FXT observations of six LLRDs demonstrate how local analogs can bypass the high-redshift LRD X-ray bottleneck. Using ∼ 1 / 1000 \sim\nicefrac{{1}}{{1000}} of the exposure for current LRD stacks, we obtain constraints tighter than those available for 95 % 95\text{\,}\% of individual LRDs with measured L 2500 L_{2500} while directly probing rest-frame soft X-rays inaccessible to Chandra at z ∼ 6 z\sim 6 .
- 2610.32430v1: Local Analogs of Little Red Dots: Clues to the X-ray Weakness
The observations reveal two X-ray classes. Two X-normal LLRDs exhibit normal to moderately enhanced X-ray emission, optical variability, and bluer optical continua. The X-weak subset, which most closely resembles high-redshift LRDs in optical/UV SED shape, Balmer diagnostics, and lack of detected variability, lies ∼ 0.65 dex \sim$0.65\text{\,}\mathrm{d}\mathrm{e}\mathrm{x}$ below the standard unobscured-quasar L 2 k e V int L_{\mathrm{2keV}}^{\mathrm{int}} – L 2500 L_{2500} relation. Stacking three X-weak LLRDs yields a 3.3 σ 3.3\sigma detection in the rest-frame 2 – 8 keV 28\text{\,}\mathrm{k}\mathrm{e}\mathrm{V} band, driven mainly by 2 – 3 keV 23\text{\,}\mathrm{k}\mathrm{e}\mathrm{V} photons. The rest-frame 0.5 – 2 keV 0.52\text{\,}\mathrm{k}\mathrm{e}\mathrm{V} band is not significantly detected ( 1.9 σ 1.9\sigma ). The moderate deficit measured from the X-weak LLRD stack remains compatible with current individual and stacked LRD constraints, showing that extreme X-ray weakness need not be universal.
- 2610.32430v1: Local Analogs of Little Red Dots: Clues to the X-ray Weakness
Table 2 summarizes the pointed EP-FXT observations obtained through our program (PI: J.-X. Wang) for the six LLRDs analyzed in this work. The exposure times were planned to yield at least a 3 σ 3\sigma detection for an intrinsic 2 – 10 keV 210\text{\,}\mathrm{k}\mathrm{e}\mathrm{V} luminosity 0.5 dex 0.5\text{\,}\mathrm{d}\mathrm{e}\mathrm{x} below that expected from the standard broad- H α \mathrm{H}\alpha AGN relation. J0850 was assigned a shorter exposure because its broad- H α \mathrm{H}\alpha luminosity is approximately 1 dex 1\text{\,}\mathrm{d}\mathrm{e}\mathrm{x} lower than those of the other targets; for this source, the observational goal was to improve upon the archival eROSITA upper limit rather than to secure an individual detection.
- 2610.32430v1: Local Analogs of Little Red Dots: Clues to the X-ray Weakness
Figure 5: Example eFXTDAS quality-assessment summary for J115438.96+065025.0, generated with fxtcombine-quickview . From upper left to lower right, the panels show the stacked count-rate map and detected-source catalog, modeled background map, target-centered extraction geometry (overlaid with contaminating sources in the source/background extraction regions), stacked exposure map, 90%-encircled-energy PSF-radius map, and limiting-flux sensitivity map.
- 2610.32430v1: Local Analogs of Little Red Dots: Clues to the X-ray Weakness
The rest-frame soft-X-ray constraints are difficult to reconcile with either the typical unobscured super-Eddington model or the local-AGN-like CT geometry examined here, although absorbed super-Eddington spectra with stronger intrinsic X-ray emission, or CT configurations with substantially enhanced scattering or low-column-density leakage cannot be excluded. The simplest explanation consistent with both the X-ray and Balmer diagnostics is a mildly X-ray-weak corona, with Δ α ox ∼ − 0.1 \Delta\alpha_{\mathrm{ox}}\sim-0.1 to − 0.2 -0.2 , viewed through Compton-thin material with N H ∼ 10 22 − 23 cm − 2 N_{\mathrm{H}}\sim 10^{22-23}\,\mathrm{cm}^{-2} . Deeper X-ray observations and growing samples of local LRD analogs will test whether this interpretation is representative and clarify the diversity and physical origin of LRD X-ray emission beyond what is currently feasible at high redshift.
- 2610.32430v1: Local Analogs of Little Red Dots: Clues to the X-ray Weakness
Table 2: Einstein Probe/FXT observation summary for the LLRDs
- 2610.32430v1: Local Analogs of Little Red Dots: Clues to the X-ray Weakness
Note. — Dates are given in UTC. The exposure is the module-averaged value, ( t FXTA + t FXTB ) / 2 (t_{\mathrm{FXTA}}+t_{\mathrm{FXTB}})/2 , summed over the listed ObsIDs; it therefore represents the effective on-source exposure rather than the module-summed collecting time. “FF” and “01” denote the full-frame observing mode and thin-filter configuration, respectively.
- 2610.32430v1: Local Analogs of Little Red Dots: Clues to the X-ray Weakness
A major question about JWST’s little red dots (LRDs) at z ∼ 4 − 8 z\sim 4-8 is the origin of their apparent X-ray weakness. Even deep Chandra stacks yield only tentative detections or broad-band limits and cannot distinguish among super-Eddington accretion, intrinsic X-ray weakness, and Compton-thick (CT) obscuration. Local analogs offer a powerful complementary route. At z ∼ 0.3 z\sim 0.3 , similarly luminous sources require ∼ 10 3 − 4 \sim 10^{3-4} less exposure for comparable signal-to-noise, suffer less source confusion, and directly probe the diagnostic rest-frame soft X-rays. Here we present a pilot Einstein Probe/FXT study of six “local little red dots” (LLRDs), V-shaped broad-line green pea galaxies selected as low-redshift counterparts of LRDs. These sources show X-ray diversity: “X-normal” LLRDs resemble type 1 AGNs in X-ray luminosity and optical variability, whereas “X-weak” stack lies ∼ \sim 0.5 – 0.7 dex 0.50.7\text{\,}\mathrm{d}\mathrm{e}\mathrm{x} below standard unobscured-quasar scaling relations while remaining compatible with the representative LRD stack and 95 % 95\text{\,}\% of published individual limits. The X-weak LLRDs also lack detected optical variability and have redder optical continua than X-normal LLRDs, making their V-shaped SEDs closer to those of high-redshift LRDs. The detection of the X-weak stack at ∼ 3.3 σ \sim 3.3\sigma with the soft-X-ray-sensitive EP-FXT provides rest-frame ∼ 2 − 3 keV \sim 2-3\,\mathrm{keV} constraints difficult to reconcile with a typical unobscured super-Eddington model or a local-AGN-like CT geometry examined here, although modified variants remain possible. The simplest alternative is a mildly X-ray-weak corona ( Δ α ox ∼ − 0.1 \Delta\alpha_{\mathrm{ox}}\sim-0.1 to − 0.2 -0.2 ) with Compton-thin absorption ( N H ∼ 10 22 − 23 cm − 2 N_{\mathrm{H}}\sim 10^{22-23}\,\mathrm{cm}^{-2} ), consistent with the independent Balmer decrement/break diagnostics. Together with growing samples of local LRD analogs, our results offer a practical path for testing the physical nature of LRD X-ray weakness.
- 2610.32430v1: Local Analogs of Little Red Dots: Clues to the X-ray Weakness
To benchmark LLRDs against AGNs and high-redshift LRDs, we fit their spectra with Xspec [ 5 ] using an absorbed AGN power-law plus fixed host-galaxy emission, attenuated by Galactic absorption: TBabs*(zTBabs agn *zpowerlw agn +host) . For X-weak LLRDs, we adopt N H = 10 22 cm − 2 N_{\mathrm{H}}=10^{22}\,\mathrm{cm}^{-2} and Γ = 1.8 \Gamma=1.8 , consistent with Yue et al. [97] , and fit only the normalization. For the X-normal LLRDs, their higher SNR allows N H N_{\mathrm{H}} and, where warranted, the photon index to vary; J0928 additionally requires partial covering. Table 1 reports the fitted parameters; Appendix E presents details and the X-normal spectra (Figure 6 ). The host component includes X-ray binaries and hot gas normalized from the stellar mass and narrow- H α \mathrm{H}\alpha -based SFR [ 57 , 72 , 51 , 65 ] . Its luminosity is only ∼ 10 40 erg s − 1 \sim 10^{40}\,\mathrm{erg}\,\mathrm{s}^{-1} , and even a dex uncertainty changes the reported nuclear luminosities or upper limits by < 5 % <5\% .
- 2606.21105v1: Little Red Dots as Supermassive Analogs of SS 433
The observed monochromatic luminosity for a given inclination i i is obtained by integrating the emergent intensity over the visible surfaces of the near and far (relative to the observer) sides of the disk (see Appendix B ). The resulting SED for an SMBH with M BH = 10 7 M ⊙ M_{\mathrm{BH}}=10^{7}M_{\odot} and m ˙ = 1000 \dot{m}=1000 is shown in Figure 4 . The spectrum is well-approximated by a blackbody with T eff = 6000 T_{\mathrm{eff}}=6000 K, and the Balmer break is clearly visible in high-inclination cases with i ≳ 60 ∘ i\gtrsim 60^{\circ} . This is due to severe geometric obscuration of the inner disk at large angles. The high-temperature UV emission is blocked by the “puffed-up” disk, making the Balmer break from the cooler outer radii more visible.
- 2606.21105v1: Little Red Dots as Supermassive Analogs of SS 433
If the BLR clouds follow a disk-like Keplerian velocity field, a high inclination angle will naturally correspond to a large line-of-sight velocity, resulting in broader lines. Our model therefore predicts a positive correlation between Balmer break strength and the full width at half maximum (FWHM) of the BELs, as tentatively observed by [ 82 ] . Consequently, single-epoch black hole mass estimators calibrated on low-inclination type-1 AGNs may introduce an inclination-dependent bias when applied to LRDs. Assuming a mean inclination of 30 ∘ 30^{\circ} for type-1 AGNs and 75 ∘ 75^{\circ} for LRDs, the inclination effect induces an overestimation factor of ( sin 30 ∘ / sin 75 ∘ ) 2 ≈ 3.7 (\sin 30^{\circ}/\sin 75^{\circ})^{2}\approx 3.7 . For LRDs with Balmer breaks, the rest-frame 5100 A ̊ 5100\ \mathring{\mathrm{A}} luminosity may be a useful empirical proxy for black hole mass.
- 2505.09669v1: Chandra Rules Out Super-Eddington Accretion Models For Little Red Dots
By co-adding the X-ray counts across all LRDs, we obtained 1444 (3730) total counts in the soft ( 0.3 − 2 0.3-2 keV) and hard ( 2 − 7 2-7 keV) band and, after normalizing the background to the same extraction area, we got 1409 (3697) background counts in the soft and hard bands, respectively. This yields 35 ± 41 35\pm 41 net counts in the soft band and 33 ± 66 33\pm 66 in the hard band, corresponding to non-detections. In the absence of detections, we derive upper limits on the flux of the stacked LRD population. To this end, we adopt the exposure maps and convert the count rates into fluxes, obtaining 3 σ 3\sigma upper limits of < 4.7 × 10 − 18 <4.7\times 10^{-18} erg/s/cm 2 in the soft and < 1.3 × 10 − 17 <1.3\times 10^{-17} erg/s/cm 2 in the hard band. We note that the choice of photon index adopted to convert the count rates into fluxes affects these latter by only ≈ 20 % \approx 20\% , leaving our main results unchanged.
- 2505.09669v1: Chandra Rules Out Super-Eddington Accretion Models For Little Red Dots
This paper is organized as follows. In Section II we describe our procedure to analyze (stack) the X-ray data; in Section III we present our results; in Section IV we discuss the implications of our X-ray non-detections and discuss the compatibility of our results with current models of X-ray weakness, and we finally draw our conclusions in Section V . In this work we adopt a flat Λ \Lambda CDM cosmology with H 0 = 70 H_{0}=70 km/s/Mpc and Ω M = 0.3 \Omega_{M}=0.3 .
- 2606.26098v1: A Population of Little Red Dot-like Quasars in SDSS
A morphological analysis on a subset of LoRDs with HSC coverage shows that the majority of sources ( > 80 % >80\% ) are compact regardless of their spectral shape (see Section IV.1 ). We find that LoRDs with a V-shaped continuum are more likely to have a resolved morphology compared to sources without the V-shape. This suggests that some of the V-shaped spectra ( ∼ 40 % \sim 40\% ) are the result of an underlying stellar population and thus are unlikely to serve as proper LRD analogs. The remaining ∼ 60 % \sim 60\% of V-shaped LoRDs are proper LRD analog candidates, but space-based imaging is necessary to quantify their compactness.
- 2606.26098v1: A Population of Little Red Dot-like Quasars in SDSS
In this paper we have shown that the JWST filters used to select LRDs at z ∼ 5 z\sim 5 align well with the SDSS filters at both z = 0.38 z=0.38 and z = 0.78 z=0.78 . We leverage this mapping to photometrically select Local Red Dots (LoRDs) from SDSS using selection criteria similar to the red1/red2 criteria from Greene et al. [45] ; our selection is given in Equations 2 and 3 . In total we find ∼ 1300 \sim 1300 QSOs which share similar photometric colors to the LRDs (Section II.1 ). While not every LoRD we identify serves as a proper analog to LRDs, this is the first step towards studying LRD-like systems in the local Universe at the population level where archival data is plentiful.
- 2510.00112v1: JWST-discovered AGN: evidence for heavy obscuration in the type-2 sample from the first stacked X-ray detection
The differences between fluxes and luminosities computed with an unabsorbed power law spectrum and with a heavily absorbed one with N H = 2 × 10 24 N_{H}=2\times 10^{24} or N H = 10 25 N_{H}=10^{25} cm − 2 \mathrm{cm^{-2}} are of the order of ∼ 20 − 30 % \sim 20-30\% in the SB and minimal in the MB and UHB, while are negligible between the two CT cases; therefore, we report only the value for the N H = 2 × 10 24 N_{H}=2\times 10^{24} CT case in 2 .
- 2510.00112v1: JWST-discovered AGN: evidence for heavy obscuration in the type-2 sample from the first stacked X-ray detection
We note that for the 1-4 keV band, a fraction of the rest-frame band moves below the Chandra low energy limit of 0.3 keV for sources at z ≳ 2 z\gtrsim 2 (almost all our sources). When computing fluxes and luminosities, we must consider that only part of the intrinsic spectrum will be included in the observed band. We correct for this effect by computing the fraction of ’missing counts’ for each source for a given spectral shape. For example, if 70% of the intrinsic photons are expected to be missing below 0.3 keV, to recover the correct count rate, the exposure time is decreased by 70%. This correction is larger for the unobscured power-law spectrum - a factor ∼ 2 \sim 2 on the final stacked flux and luminosity values - than for the Compton thick obscuration case, since the fraction of soft photons is much larger in the first case.
- 2602.21002v1: Constraints on dynamically-formed massive black holes in Little Red Dots from X-ray non-detections
Our collision-based BH formation scenario provides a natural explanation for the detection of over massive BHs and reconciles their presence with the reported weakness of X-ray signals without requiring high levels of obscuration. Indeed, for our most extreme case, where all the BHs are continuously accreting and emitting 30 % 30\% of their Eddington luminosity in X-rays, at solar metallicities a column density of only N ave ∼ 3 × 10 18 N_{\rm ave}\sim 3\times 10^{18} cm -2 is required to be compatible with the observational constraints, while at lower metallicities ( Z = 10 − 2 Z=10^{-2} Z ⊙ ) a column density around N ave ∼ 2 × 10 21 N_{\rm ave}\sim 2\times 10^{21} cm -2 is enough to reduce the X-ray emission. However, as explored in Appendix C , the subsequent growth should then be well-regulated to be compatible with the X-ray constraints, at least for the typical population. Indeed, a moderate sub-Eddington accretion rate ( L / L Edd ≈ 0.1 L/L_{\rm Edd}\approx 0.1 ) —consistent with typical Type 1 AGNs—provides a plausible explanation to consider the existence of accretion. Nonetheless, we also point out that JWST has even found some more peculiar sources with BH to bulge mass ratios of order 40 % 40\% ( Juodžbalis et al., 2024a ) . In such cases, the combination of high seed masses plus very efficient accretion could be a promising way to explain the extreme outcomes in the more extreme sources. More extreme scenarios in which β \beta takes on higher values ( β ≳ 1.2 \beta\gtrsim 1.2 ), resulting in significantly earlier seed formation times and consequently altering the requirements for the subsequent accretion history and duty cycles, are discussed in detail in Appendix C .
- 2602.21002v1: Constraints on dynamically-formed massive black holes in Little Red Dots from X-ray non-detections
We emphasize that the conclusion above—that moderate sub-Eddington accretion is sufficient—relies on the adoption of a collision-favorable evolutionary track ( α = 0.7 , β = 1.4 \alpha=0.7,\beta=1.4 ). In this regime, the BH seed forms with a significant fraction of the final mass. In contrast, for ’standard’ galaxy evolution scenarios (e.g., β ≈ 0.6 \beta\approx 0.6 , typical of local spirals), the collisional seeds are significantly smaller ( M seed ≪ M final M_{\rm seed}\ll M_{\rm final} ). Consequently, these scenarios require substantial mass growth via gas accretion to match the observed LRD BH masses. This implies a need for higher time-averaged accretion rates (higher k k ) or duty cycles approaching unity. As shown in our main analysis (Fig. 11 ), these accretion-dominated scenarios would result in X-ray fluxes that exceed the stacking upper limits unless extreme obscuration is invoked. Thus, the X-ray non-detections indirectly favor the ’heavy seed’ evolutionary paths where the duty cycle can remain low.
- 2603.01473v1: Local Analogs of Little Red Dots: Optical Variability and Evidence for an AGN Origin
It is also useful to compare our results with previous variability studies of local LRDs. [ 11 ] investigated the optical variability of three local LRDs reported in [ 36 ] using light curves spanning ∼ 5 \sim 5 yrs and reported weak intrinsic variability . In contrast to our approach, they infer the intrinsic variability by modeling light curves that have relatively large photometric uncertainties. As their sources have g g -band magnitudes comparable to ours, the S/N of the light curves is similarly limited. In such a low S/N regime, intrinsic variability estimates can be sensitive to the treatment of photometric uncertainties and assumed variability models. Therefore, differences in methodology may contribute to the discrepancy between the inferred variability amplitudes.
- 2603.01473v1: Local Analogs of Little Red Dots: Optical Variability and Evidence for an AGN Origin
Although we adopt a specific epoch set corresponding to a particular LRD, this source has the longest baseline in the sample of [ 31 ] . We verify that using epoch sets drawn from other LRDs with shorter baselines yields nearly identical results (see Appendix A for details). This indicates that the dominant uncertainty arises from a short baseline of currently limited observation, rather than from the details of any individual object.
- 2603.10162v1: The X-ray weakness of Little Red Dots and JWST-selected AGN: comparison with local AGN in different accretion regimes
Table 1 : Summary of the AGN subsamples used in this work, including selection criteria, sample size, and the method adopted to derive key physical parameters. 2 2 2 References. (1) Mejía-Restrepo et al. (2022) ;(2) Ricci et al. (2017) ; (3) Gupta et al. (2024) ; (4) Wu and Shen (2022) ; (5) Webb et al. (2020) ; (6) Jin et al. (2012b) ; (7) Du et al. (2014) ; (8) Du et al. (2015) ; (9) Castelló-Mor et al. (2016) ; (10) Tortosa et al. (2023) ; (11) Yue et al. (2024) ; (12) Maiolino et al. (2025) ; (13) Lin et al. (2026) .
- 2603.10162v1: The X-ray weakness of Little Red Dots and JWST-selected AGN: comparison with local AGN in different accretion regimes
We note that in low-redshift comparison samples (BASS, SDSS–4XMM, NLS1s, and SEAMBHs), all sources have both broad H α \alpha and X-ray measurements as a natural consequence of the sample construction and survey depths, rather than as a result of additional selection cuts applied in this work. In particular, the SDSS–4XMM sources are optically classified as type I AGN based on the presence of a broad H α \alpha line component in their SDSS spectra, with no similarly broad [OIII] counterpart, while their X-ray detections arise from archival XMM- Newton observations of sufficient depth at low z z . Similarly, BASS AGN are bright, nearby systems with well-characterized optical broad-line emission and X-ray detections. In contrast, the LRDs and JWST-selected AGN are primarily selected via rest-frame UV and optical spectroscopy, and their X-ray measurements are almost exclusively limited to upper limits due to their observed X-ray weakness and current sensitivity constraints. Indeed, if their spectra are intrinsically steep (i.e., very soft), then at high z z much of the emission is redshifted out of the observed band, leading to a substantial loss of detected photons with current X-ray instruments. This difference reflects observational limitations rather than intrinsic selection biases and should be borne in mind when comparing the distributions.
- 2606.30757v1: Unveil the nature of JWST-AGN and Little Red Dots with SKAO continuum surveys
Figure 1: Visual representation of the series of failed attempts to detect the radio continuum emission in AGN discovered by JWST via stacking experiments. Blue points represent the results from stacking experiments of photometrically selected LRDs, while red markers indicate samples of spectroscopically confirmed Type I AGN. The average redshift of the samples are 5 < z < 6 5<z<6 .
- 2606.30757v1: Unveil the nature of JWST-AGN and Little Red Dots with SKAO continuum surveys
Table 1: Summary table of the stacking attempts performed so far to detect JWST-discovered AGN and LRDs in radio images. The first column refers to the literature work in which the stacking was performed, the second is ’S’ if the sample was spectroscopic and ’P’ if photometric, the third refers to the number of objects in the stack, the fourth to the frequency of the radio image, the fifth the the 3 σ 3\sigma upper limit obtained from the stack.
Abstract
A major question about JWST's little red dots (LRDs) at $z\sim4-8$ is the origin of their apparent X-ray weakness. Even deep Chandra stacks yield only tentative detections or broad-band limits and cannot distinguish among super-Eddington accretion, intrinsic X-ray weakness, and Compton-thick (CT) obscuration. Local analogs offer a powerful complementary route. At $z\sim0.3$, similarly luminous sources require $\sim10^{3-4}$ less exposure for comparable signal-to-noise, suffer less source confusion, and directly probe the diagnostic rest-frame soft X-rays. Here we present a pilot Einstein Probe/FXT study of six "local little red dots" (LLRDs), V-shaped broad-line green pea galaxies selected as low-redshift counterparts of LRDs. These sources show X-ray diversity: "X-normal" LLRDs resemble type 1 AGNs in X-ray luminosity and optical variability, whereas the "X-weak" stack lies $\sim0.5-0.7$ dex below standard unobscured-quasar scaling relations while remaining compatible with the representative LRD stack and 95% of published individual limits. The X-weak LLRDs also lack detected optical variability and have redder optical continua than X-normal LLRDs, making their V-shaped SEDs closer to those of high-redshift LRDs. The detection of the X-weak stack at $\sim3.3σ$ with the soft-X-ray-sensitive EP-FXT provides rest-frame $\sim2-3$ keV constraints difficult to reconcile with a typical unobscured super-Eddington model or a local-AGN-like CT geometry examined here, although modified variants remain possible. The simplest alternative is a mildly X-ray-weak corona ($Δα_{\mathrm{ox}}\sim-0.1$ to $-0.2$) with Compton-thin absorption ($N_{\mathrm{H}}\sim10^{22-23}$ cm$^{-2}$), consistent with the independent Balmer decrement/break diagnostics. Together with growing samples of local LRD analogs, our results offer a practical path for testing the physical nature of LRD X-ray weakness.
Discussion
Discussion access requires a security token. Register for the weekly digest.