2610.41584v1 · First listed 2026-11-02
Co-evolution of AGN and Host Galaxies across Cosmic Time Using JWST data
Across 2,709 SMILES–JADES sources at 0.05<z<6, AGN luminosity tracks recent star formation and dust emission more strongly than stellar mass. PCA identifies activity and age axes, but the inferred cold-gas driver is an interpretation rather than a direct gas measurement. [1][3]
Evidence
The authors cross-match SMILES and JADES multi-wavelength JWST catalogues to analyse 2,709 galaxies over 0.8–12.9 Gyr lookback time. Pearson correlations give L_AGN correlations of about 0.8 with SFR and dust luminosity, about 0.5 with stellar mass, and about −0.4 with SFH duration and stellar age. They then reduce selected SFR_10 Myr, stellar, SFH, and dust-related parameters with PCA, globally and by lookback time and AGN fraction. PC1 (about 59%) is an activity/scale axis and PC2 (about 34%) a stellar-maturation axis; together they account for over 90% of variance. In the supplied extraction, redshift-binned correlations span r≈0.49–0.90, but no formal errors on the headline global coefficients are reported. [1][5][8][10][3]
Earlier work
A directly relevant supplied comparison uses the same SMILES and JADES survey resources but asks a different question: 2607.25696 finds no strong systematic dependence of AGN IR contribution or number fraction on total IR luminosity within its uncertainties. This work instead reports a positive object-level L_AGN–L_dust correlation. These findings are not inherently contradictory: AGN fraction/number statistics and fitted AGN luminosity versus dust luminosity are distinct observables, and the supplied evidence does not establish matched selections or estimators. [12][11][1]
What changes
The paper’s contribution is a joint correlation-and-PCA description across a broad redshift baseline rather than a single AGN-incidence measurement. It reports aligned PCA loadings for AGN luminosity, recent SFR, and dust luminosity at high lookback time, and a bimodal host-dominated population at late times. To test luminosity-selection sensitivity, the authors also repeat PCA in three volume-limited subsamples and state that the qualitative result is consistent. They interpret the alignment as synchronized black-hole and galaxy growth in gas-rich systems. [1][7][4]
Limits and open questions
The analysis establishes correlations and PCA covariation, not a causal fueling mechanism. The authors explicitly find that the age–L_AGN anti-correlation is driven by cosmic time rather than a direct physical link; redshift can likewise contribute to other global trends. Cold-gas supply is not directly measured in the supplied text, so its role is interpretive. The extraction does not provide SED-model assumptions, treatment of measurement errors, redshift-quality information, or coefficient uncertainties; consequently, robustness beyond the reported volume-limited PCA check cannot be assessed here. [1][7]
The main paper has abstract and selected HTML-block extraction, but no supplied methods, tables, or full figure discussion. Figure interpretations are therefore restricted to captions and extracted summary text; uncertainty and SED-modelling details are unavailable.
Key figures
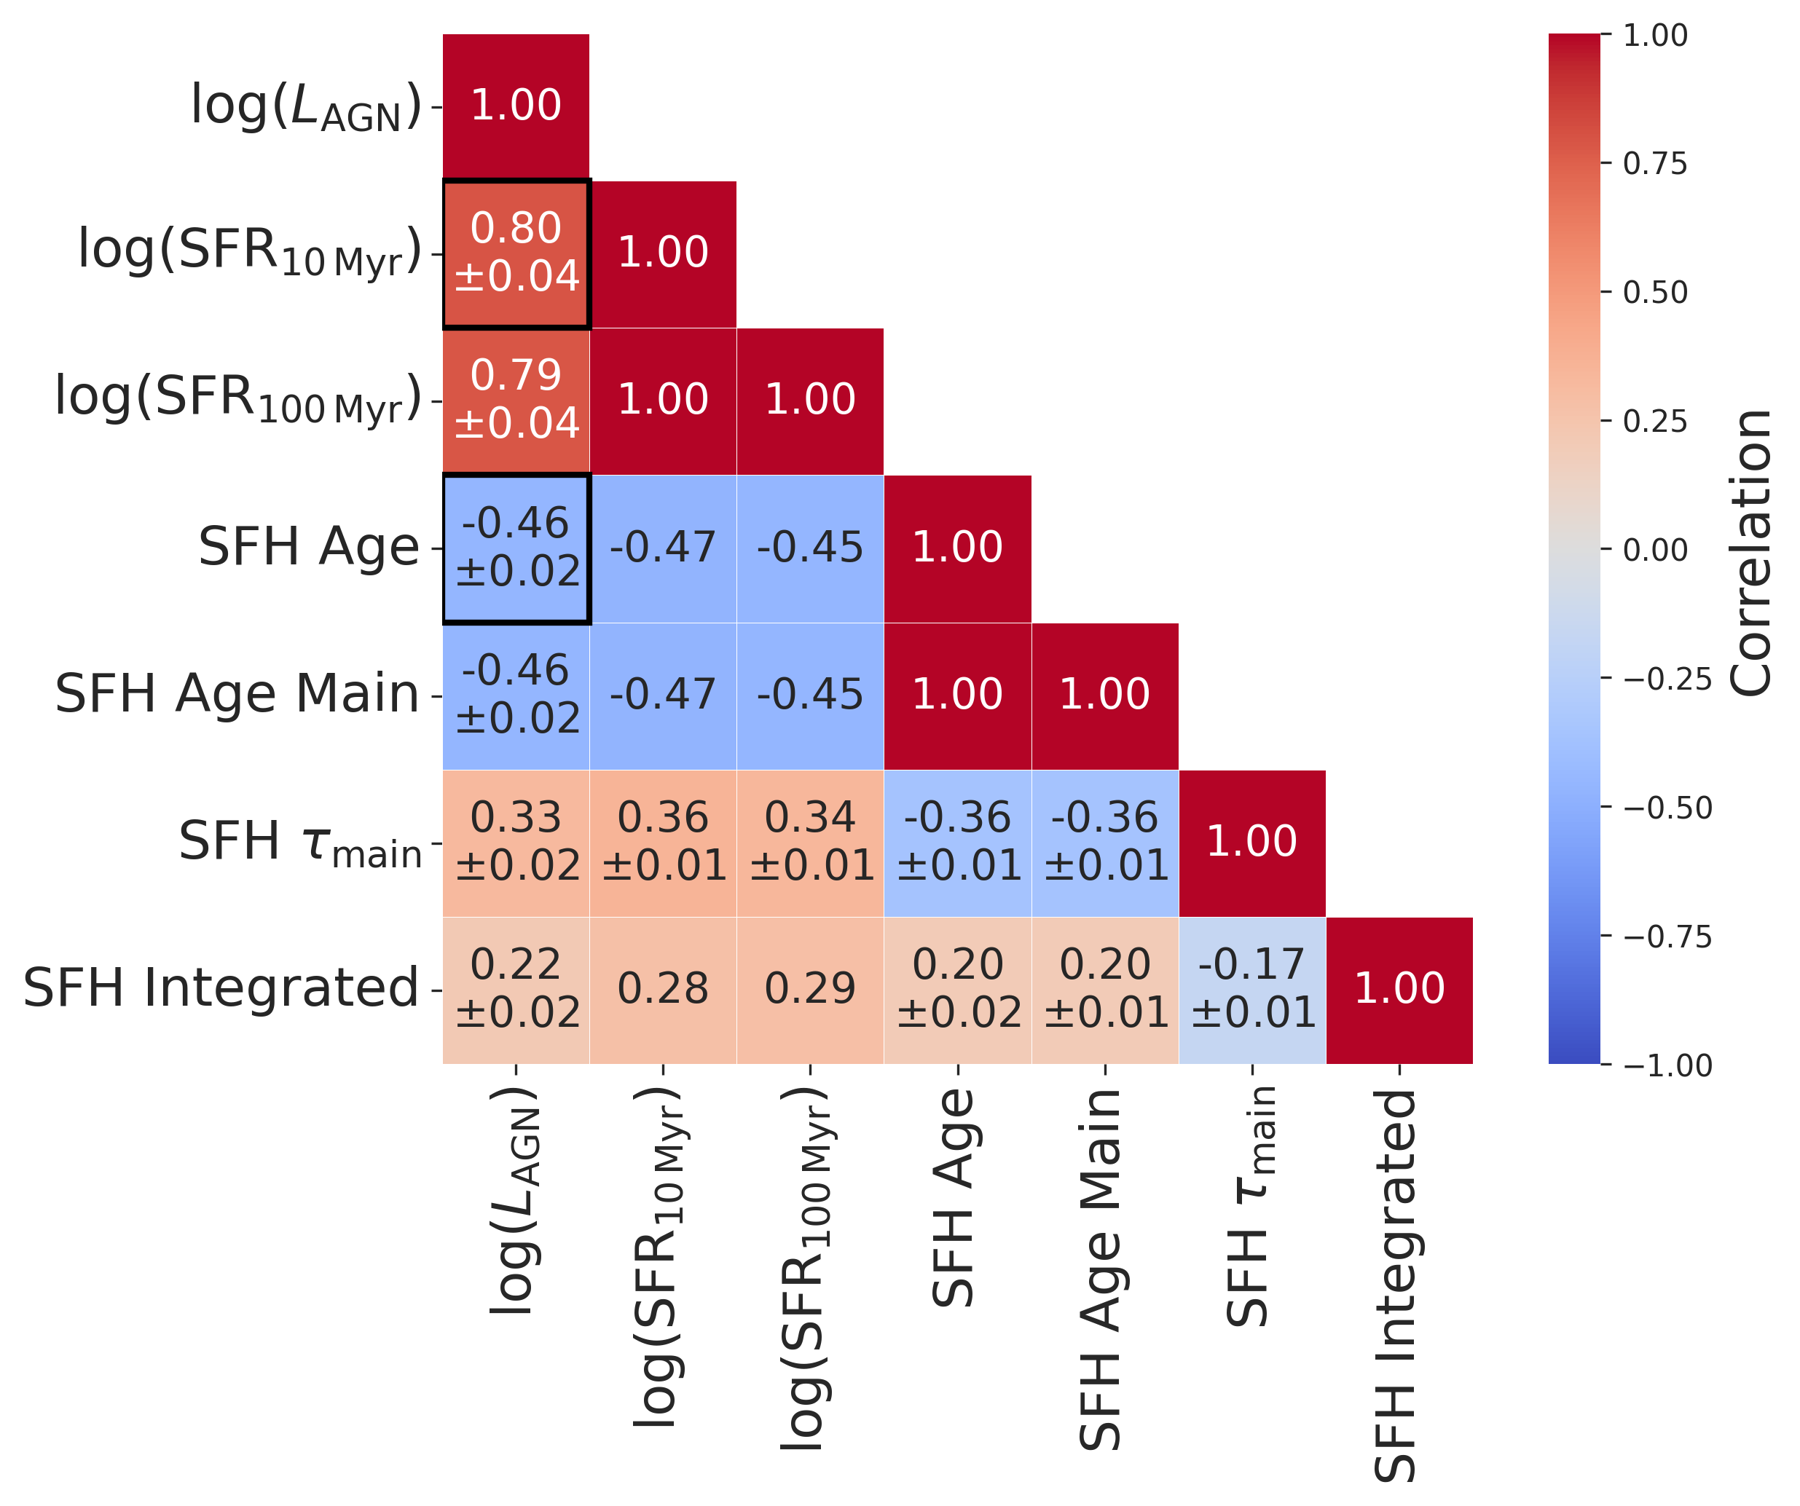
Tests the pairwise correlation structure between AGN luminosity and SFH-module quantities, including SFR and SFH parameters; it is the correlation-analysis basis for selecting highlighted parameters.
Original caption
Figure 1 : Correlation matrix illustrating the physical relationships between AGN luminosity ( log L AGN \log L_{\mathrm{AGN}} ), with in the SFH module including star formation rate (SFR), and star formation history (SFH) parameters.


Tests whether L_AGN varies with recent (10 Myr) SFR and SFH duration, separating total, host-dominated, and AGN-dominated samples and encoding redshift by colour.
Original caption
Figure 4 : Top panel : AGN luminosity versus recent star formation rate ( SFR 10 Myr {\rm SFR}_{10\,\mathrm{Myr}} ) for total [left], host-dominated [middle], and AGN-dominated samples [right]. The color bar shows the redshift of the sources. Bottom panel : Correlation between AGN luminosity ( L AGN L_{\rm AGN} ) and the duration of the star formation history (SFH Age [Myr]).
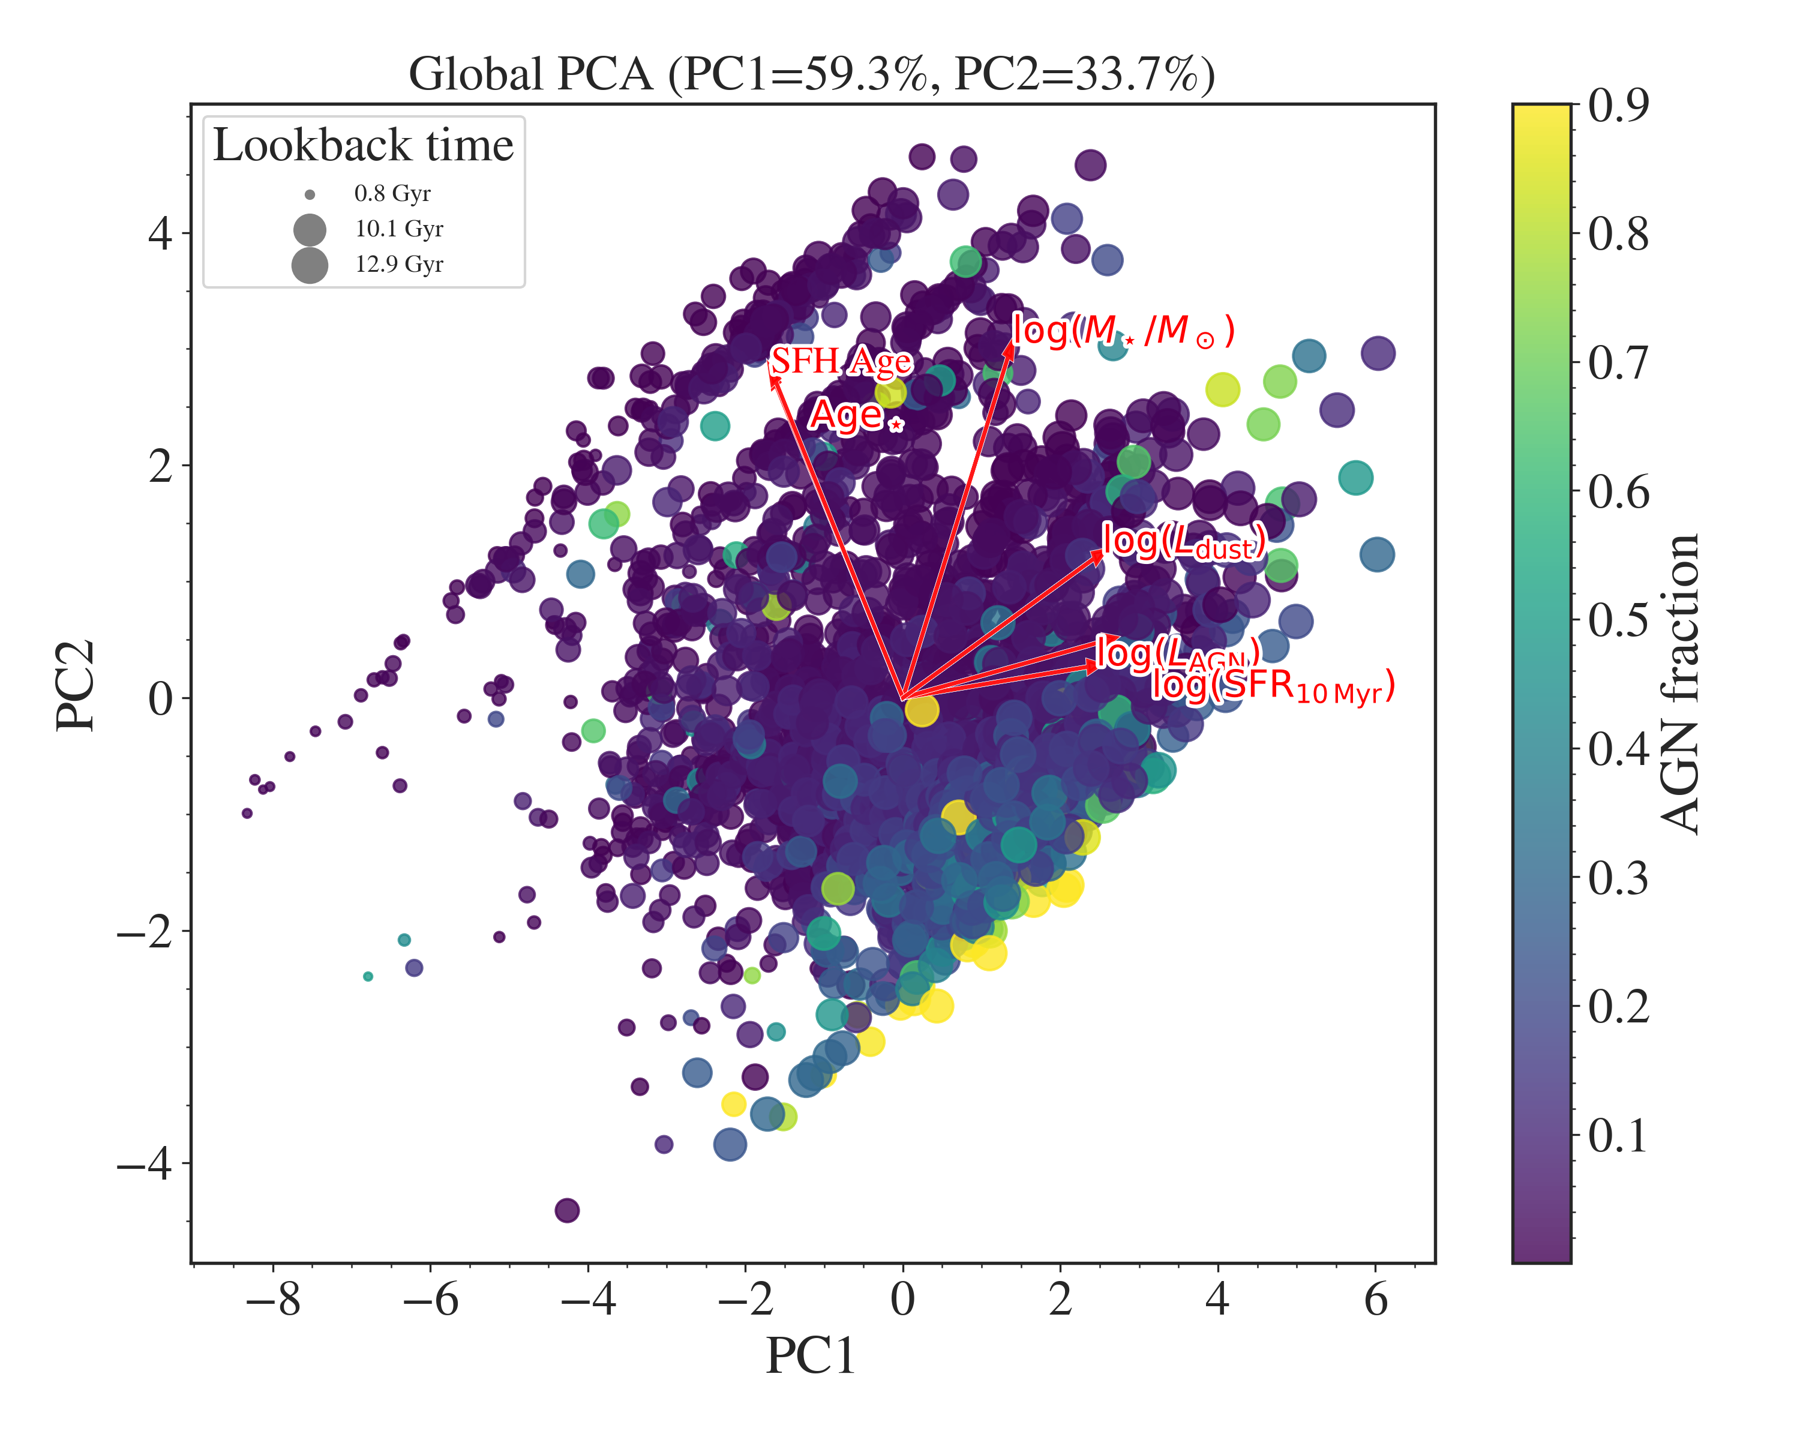
Tests whether a low-dimensional PCA describes the full sample: PC1 is the activity axis and PC2 the age/evolution axis, together explaining 93% of variance according to the caption.
Original caption
Figure 7 : Global principal component analysis (PCA) of the full galaxy sample ( N = 2709 N=2709 ), explaining 93% of the total variance. PC1 (59.3%) traces an activity axis defined by L AGN L_{\rm AGN} , SFR 10 Myr {\rm SFR}_{10\,{\rm Myr}} , and L dust L_{\rm dust} , while PC2 (33.7%) represents an evolutionary axis where Age ∗ {\rm Age}_{*} and SFH age are co-aligned and anti-correlated with activity. High AGN fractions populate the high-activity, young regime, with high-redshift systems driving the variance along PC1. To plot the arrows we plot the loadings multiplied by a factor of five for visual clarity.
Related research
Previous digest
Using 2,709 SMILES–JADES sources in GOODS-S over 0.05 < z < 6, Jalan et al. use multi-wavelength JWST SED fits, correlation matrices, and PCA to ask which host properties most closely track AGN bolometric luminosity. L_AGN correlates strongly with recent SFR and dust luminosity, more weakly with stellar mass, while its apparent anti-correlation with stellar age and SFH duration is largely a cosmic-time effect rather than a direct causal link. The PCA identifies an activity axis joining AGN power, star formation, and dust emission and a separate stellar-age axis, supporting a picture in which cold-gas supply synchronizes black-hole growth and star formation most tightly at early epochs, whereas low-f_AGN hosts become bimodal into quiescent and star-forming populations at late times.
Sources and evidence (25)
- 2610.41584v1: Co-evolution of AGN and Host Galaxies across Cosmic Time Using JWST data
Understanding the complex co-evolution of active galactic nuclei (AGN) and their host galaxies across cosmic time remains a fundamental challenge, particularly in identifying how the physical drivers of galaxy diversity evolve from the early Universe to the present day. To understand this, we use a multi-wavelength JWST catalog of 2,709 sources cross-matched from the SMILES and JWST Advanced Deep Extragalactic Survey (JADES) surveys, spanning lookback times from 0.8 to 12.9 Gyr ($0.05 <z <6$). Using Pearson correlation matrix, we find AGN luminosity ($L_{\mathrm{AGN}}$) strongly correlates ($\sim0.8$) with star formation rate (SFR) and dust luminosity ($L_{\mathrm{dust}}$), weakly correlates ($\sim0.5$) with stellar mass ($M_\star$) and anti-correlates ($\sim -0.4$) with star formation history (SFH) duration and stellar age (Age$_\star$). However, the apparent anti-correlation observed between galaxy age and AGN luminosity is driven by cosmic time rather than by a direct physical connection. Using Principal Component Analysis (PCA), we find that galaxy diversity is fundamentally governed by two principal components: AGN and galaxy activity, and stellar age. At higher redshifts, AGN accretion, star formation, and dust emission are tightly synchronized, reflecting gas-rich conditions in the early Universe. In contrast, the present Universe exhibits a clear bimodal structure in host-dominated systems ($f_{\mathrm{AGN}} \leq 0.2$), separating quiescent and star-forming galaxies. Our results demonstrate that AGN luminosity is primarily governed by the host galaxy's current cold-gas supply, of which recent star formation is a close observational tracer, with galaxy mass setting the overall potential. This highlights a co-evolution scenario in which black hole growth and star formation are tightly linked, particularly at early cosmic epochs.
- 2610.41584v1: Co-evolution of AGN and Host Galaxies across Cosmic Time Using JWST data
Our results show that AGN luminosity is most strongly correlated with indicators of recent activity, particularly star formation rate and dust luminosity, consistent with a shared dependence on cold gas reservoirs [ 13 , 9 , 100 , 71 ] . In contrast, weaker correlations with structural parameters suggest that integrated galaxy properties play a secondary role. PCA further reveals that the majority of variance ( > 90 % >90\% ) is captured by two components: an activity (or scale) axis linking AGN power, star formation, and dust emission, and an evolutionary axis associated with stellar age.
- 2610.41584v1: Co-evolution of AGN and Host Galaxies across Cosmic Time Using JWST data
In conclusion, the analysis of 2,709 galaxies spanning ∼ \sim 13 Gyr of cosmic time reveals that galaxy evolution is fundamentally governed by two principal components: a scale and activity axis (PC1, ∼ \sim 59% of the variance) and a stellar maturation axis (PC2, ∼ \sim 34%). Across all redshifts, AGN luminosity ( L AGN L_{\mathrm{AGN}} ) is strongly correlated with star formation rates, young stellar and gas mass, indicating that black hole growth traces the active, gas-rich phase of galaxy evolution. The evolution from a tight coupling between AGN activity and star formation at early times to a stronger association with dust emission at later epochs reflects the progressive maturation of the galaxy population from rapid growth phases to the diverse structures observed in the present-day Universe.
- 2610.41584v1: Co-evolution of AGN and Host Galaxies across Cosmic Time Using JWST data
The higher lookback-time bins of all three subsamples reveal a remarkably coherent PCA structure indicative of synchronized galaxy and black hole growth in the early Universe. Consistent with previous results, in these epochs, the loading vectors associated with AGN luminosity, recent SFR, and dust luminosity are closely aligned along the positive PC1 axis, suggesting that black hole accretion and star formation were tightly coupled processes, both fuelled by a common reservoir of cold gas in gas-rich galaxies.
- 2610.41584v1: Co-evolution of AGN and Host Galaxies across Cosmic Time Using JWST data
The resulting set of highlighted parameters (e.g. SFR 10 Myr \mathrm{SFR}_{10\,\mathrm{Myr}} , M ⋆ M_{\star} , and SFH Age) shown in Figure. 1 – 3 is used for the subsequent analysis. Module-wise grouping is adopted for clarity of visualization and to facilitate the physical interpretation of the relationships with AGN luminosity.
- 2610.41584v1: Co-evolution of AGN and Host Galaxies across Cosmic Time Using JWST data
Table 1 : Summary of PCA Vectors for the entire sample.
- 2610.41584v1: Co-evolution of AGN and Host Galaxies across Cosmic Time Using JWST data
To understand whether the conclusions are robust we perform PCA across three distinct volume-limited subsamples (Appendix: B ) and found consistent results.
- 2610.41584v1: Co-evolution of AGN and Host Galaxies across Cosmic Time Using JWST data
Based on the correlation analysis of a multi-wavelength catalog of 2,709 sources, we identify galaxy parameters that are most strongly connected to SMBH growth. We remove redundant information while preserving key correlations and explore the joint parameter space via PCA, both globally and in bins of lookback time and AGN fraction.
- 2610.41584v1: Co-evolution of AGN and Host Galaxies across Cosmic Time Using JWST data
The statistical analysis demonstrates that L AGN L_{\mathrm{AGN}} is a strong indicator of a young and active galaxy state:
- 2610.41584v1: Co-evolution of AGN and Host Galaxies across Cosmic Time Using JWST data
Strong positive correlations with dust luminosity, stellar mass and SFR, even in various redshift bins ( r ≈ 0.49 r\approx 0.49 – 0.90 0.90 ). .
- 2607.25696v1: Tracing Obscured AGN Contribution and Number Fraction Across 0 < z < 6 with JWST
However, we do not find strong statistical evidence for a systematic dependence of either AGN contribution or AGN number fraction on total IR luminosity, as both trends remain broadly consistent with being flat within the uncertainties. These results appear inconsistent with other works like [ 15 ] who despite also using AKARI like [ 64 ] uses 18 NIR and MIR bands (9 more) and suggests that AGN contribution actually increases with increased luminosity. [ 18 ] reports finding more AGNs in more IR luminous systems using Herschel-PACS observations in the same GOODS-S file we use in our study. Additionally, [ 25 ] matched data from IRAS and SDSS resulting in 4248 IRGs, and found that AGN number fraction increases with total IR luminosity. He also shows how [OIII] luminosity and IR luminosity present a good correlation and may be used to find more AGNs. [ 35 ] used a sample of 70 μ \mu m selected galaxies from Spitzer and reported that sources identified as AGN constitute over 70% of sources at high luminosity (log( L / L ⊙ L/L_{\odot} ) > > 12). These differences may arise from a combination of sample selection, AGN identification techniques, wavelength coverage, and the improved sensitivity of JWST, which enables the detection of fainter and more heavily obscured AGN populations than were accessible to previous infrared surveys.
- 2607.25696v1: Tracing Obscured AGN Contribution and Number Fraction Across 0 < z < 6 with JWST
This paper is structured as follows. In Section II , we describe the datasets used in this study, including the JWST SMILES and JADES surveys, as well as the SED fitting procedure and sample selection. In Section III , we present our main results, focusing on the evolution of AGN IR contribution and AGN number fraction as functions of redshift and total IR luminosity. In Section IV , we discuss the implications of these results and compare them with previous studies. Finally, in Section V , we summarize our main conclusions and highlight potential directions for future work.
- 2506.13852v1: Overmassive black holes in the early Universe can be explained by gas-rich, dark matter-dominated galaxies
For comparison, we include results from the TNG50 simulations ( Nelson et al., 2019 ; Pillepich et al., 2019 ) . We follow the same procedure as for thesan-zoom , and only include central galaxies with M ∗ > 10 7 M ⊙ M_{\ast}>10^{7}\,\mathrm{M_{\odot}} . There is a publicly available catalog of morphological decompositions for TNG50 for galaxies with M ∗ > 10 9 M ⊙ M_{\ast}>10^{9}\,\mathrm{M_{\odot}} ( Zana et al., 2022 ) . While this catalog does not give the information needed to calculate the dynamical masses of the bulge, it does allow us to restrict our sample to bulge-dominated galaxies, where the thick and thin disks comprise less than 25% of the stellar mass. At z = 3 z=3 , TNG50 shows a comparable relation to thesan-zoom , whereas by z = 0 z=0 the inferred BH masses have decreased rapidly. At higher masses at z = 0 z=0 , bulge-dominated galaxies in TNG50 scatter around the local elliptical relation, as expected.
- 2506.13852v1: Overmassive black holes in the early Universe can be explained by gas-rich, dark matter-dominated galaxies
Interestingly, the observed gas fractions in JADES galaxies and our measured fractions in thesan-zoom galaxies (excluding galaxies with extremely low gas fractions) show no clear evidence of redshift evolution at z > 3 z>3 . In Fig. 2 , we also show results from the xGASS survey of gas fractions in bins of stellar mass. For galaxies with M ∗ ≲ 10 9.5 M ⊙ M_{\ast}\lesssim 10^{9.5}\,\mathrm{M_{\odot}} , the local gas fractions agree with those we measure at z > 3 z>3 in JADES and in the thesan-zoom simulation. However, at M ∗ ≳ 10 9.5 M ⊙ M_{\ast}\gtrsim 10^{9.5}\,\mathrm{M_{\odot}} we find significant disagreement, with f gas ≈ 0.6 f_{\mathrm{gas}}\approx 0.6 in JADES and thesan-zoom at M ∗ = 10 10 M ⊙ M_{\ast}=10^{10}\,\mathrm{M_{\odot}} , compared to f gas ≈ 0.25 f_{\mathrm{gas}}\approx 0.25 in xGASS. It appears that higher mass galaxies show significant evolution at z < 3 z<3 , whereas low mass galaxies do not. This is plausibly due to the increased fraction of quenched galaxies at z ≈ 0 z\approx 0 , which are predominantly more massive and have low gas fractions. To gain further insight into the evolution down to z = 0 z=0 , we also show f gas f_{\mathrm{gas}} and f DM f_{\mathrm{DM}} from TNG50. We followed the same procedure as for thesan-zoom , and we do not enforce a bulge-dominated selection for this comparison. TNG50 shows consistently lower f gas f_{\mathrm{gas}} across the stellar mass range, and lower f DM f_{\mathrm{DM}} at higher stellar masses, indicating evolution of the M ∗ − M dyn M_{\ast}-M_{\mathrm{dyn}} relation. We note, however, that f DM f_{\mathrm{DM}} is aperture-sensitive, and even tends to increase at extremely high stellar masses ( M ∗ ≳ 10 11 M ⊙ M_{\ast}\gtrsim 10^{11}\,\mathrm{M_{\odot}} ) in IllustrisTNG ( Lovell et al., 2018 ) . To calculate M BH M_{\mathrm{BH}} for IllustrisTNG galaxies, an even smaller aperture would likely be appropriate to reflect the bulge radius, which would further reduce f DM f_{\mathrm{DM}} , particularly at higher stellar masses. Interestingly, at z = 3 z=3 , TNG50 shows similar f DM f_{\mathrm{DM}} and f gas f_{\mathrm{gas}} as thesan-zoom , except at M ∗ ≳ 10 9.5 M ⊙ M_{\ast}\gtrsim 10^{9.5
- 2501.11491v1: MIDIS: Quantifying the AGN component of X-ray-detected galaxies
Since the discovery that the cosmic X-ray background was isotropic ( Fabian & Barcons, 1992 ) , there followed major interest in determining the contributions of discrete source populations, as a function of X-ray energy. These studies combined the results from all-sky catalogues which sampled the discrete sources at limited X-ray sensitivity, with deeper serendipitous samples of sources scattered around the sky e.g. using Chandra and XMM-Newton. These studies ( Cappelluti et al., 2017 ) have resolved more than 90% of the background below 10 keV into different classes of AGN, including unabsorbed sources, partially obscured sources and Compton thick sources. At energies greater than 10 keV the fractions of the AGN population change in favour of the obscured sources. Although there is a correlation between X-rays and the mid-infrared (MIR), it was shown that using a MIR colour selection criterion based on the WISE all sky survey ( Stern, 2015 , e.g.) , missed a significant fraction of AGN detected in hard X-ray by NuSTAR and XMM-Newton ( Mateos et al., 2012 ) . Since the Mid Infrared Instrument (MIRI; Wright et al. 2023 ) on board JWST offers so much greater sensitivity and spatial resolution compared with all previous mid-IR facilities, it is now possible to spatially resolve high redshift ( z z > > 1) galaxies in the mid-infrared ( Boogaard et al. 2024 ; Costantin et al. 2024 ).
- 2501.11491v1: MIDIS: Quantifying the AGN component of X-ray-detected galaxies
At least 70% of the sources show unresolved emission in the MIRI images, with the unresolved-to-total flux fraction ranging from ∼ \sim 0.2 to ∼ \sim 0.9. About half of our sample have published X-ray column densities ( Luo et al., 2017 ) . We find no strong correlation between the column densities and the ratio of the point-source component to the total 2-micron rest-frame luminosity. For an obscured AGN having a high column density, we might have expected a smaller point-source contribution.
- 2503.19078v1: MEGA Mass Assembly with JWST: The MIRI EGS Galaxy and AGN Survey
To test the quality of our source detection, we test for false positives two ways. We rereduce the CEERS obervations and use our detection method and fount a false positive rate of 3.5%. However, we note our super background method makes use of a large set of observations and due to CEERS being split over two period the super backgrounds are created based on 8 _cal.fits files which is 11 times smaller than our MEGA observations. Additionally, we rereduce our observations to match the CEERS reductions and detection method found a false positive rate of 2.1%. Our photometic reductions also found 140 new source increasing the catalog by 4.6%.
- 2503.19078v1: MEGA Mass Assembly with JWST: The MIRI EGS Galaxy and AGN Survey
We have estimated the imaging depth for each pointing/band to be 0.18 μ \mu m, 0.41 μ \mu m, 1.26 μ \mu m, and 4.1 μ \mu m for the F770W, F1000W, F1500W, and F2100W filters respectively. These are comparable to 80% completeness we derive. This completeness is then used to derive number counts for the fields. Our total number counts are comparable to CEERS and SMILES, and the deviation could be explained by difference in the fields, as shown by the deviation in our individual MIRI pointings number counts. These assessments indicate that our MIRI photometry catalog is of good quality and is able to complete our science goals.
- 2604.07138v1: The Way We Tally Becomes the Tale: the Impact of Selection Strategies on the Inferred Evolution of Little Red Dots Across Cosmic Time
Finally, the F277W – F444W \mathrm{F277W\text{--}F444W} color distribution shows that very red sources (e.g., ≳ 1.5 \gtrsim 1.5 mag; Akins et al. 1 ) constitute only a minor fraction of the LRD population ( ≲ 25 % \lesssim 25\% ), consistent with recent spectroscopic results ( Pérez-González et al. 107 ). The majority instead occupy significantly bluer optical/NIR colors (e.g., ≈ 55 \approx 55 % with F277W – F444W = 0.5 – 1 \rm F277W\text{--}F444W=0.5\text{--}1 mag). This region of parameter space remains largely unexplored, likely biasing current samples toward an extreme subset of LRDs [ 107 ] rather than the full population. If current selection criteria, and subsequent follow-up efforts, are preferentially sensitive to the reddest systems, then our current view of LRDs is inherently biased toward a specific sub-population, preventing both (i) a meaningful inference of their evolutionary trends across cosmic time and (ii) a robust physical interpretation of the LRD phenomenon, by disproportionately emphasizing a single sub-type of a broader, heterogeneous population (e.g., Barro et al. 14 , Pérez-González et al. 107 ), potentially favoring ad hoc models and hindering the development of a unified framework that captures their full diversity and possible evolutionary pathways.
- 2604.07138v1: The Way We Tally Becomes the Tale: the Impact of Selection Strategies on the Inferred Evolution of Little Red Dots Across Cosmic Time
As a sanity check, motivated by recent results showing that photometrically selected LRDs can also be contaminated by quiescent galaxies (in addition to brown dwarfs and strong-line emitters), we cross-matched our sample with the catalog of (photometrically selected) quiescent galaxies in the JADES fields presented by Baker et al. [11] [ 10 , using the criteria of] . We find three matches. Among these three sources, two show clear photometric excess in the medium bands at the wavelengths expected for H β \beta +[O iii ] and H α \alpha (IDs 152330 and 226386; JADES-GS+53.1027-27.7444 and JADES-GS+53.1912-27.8357), indicating the presence of emission lines and therefore disfavoring a quiescent interpretation [ 25 , 66 , 10 , although an AGN within a quiescent galaxy remain a potential explanation; e.g.,] . The third source is excluded from our sample, as we cannot draw firm conclusions on its nature. For JADES-GS+53.1027 − - 27.7444, a NIRCam/WFSS spectrum from FRESCO is available and reveals a broad H α \alpha component with a full width at half maximum (FWHM) of 2068.78 ± 40.82 2068.78\pm 40.82 km s -1 , which was not reported in previous analyses based on FRESCO data such as Matthee et al. [92] .
- 2511.11835v1: Infrared Signatures of Dusty Tori Formed by MHD-Driven Outflows
Table 4 : Best-fit results (AGN density law ρ ( r ) ∝ r − 1 \rho(r)\propto r^{-1} )
- 2511.11835v1: Infrared Signatures of Dusty Tori Formed by MHD-Driven Outflows
Table 5 : Best-fit results (AGN density law ρ ( r ) ∝ r − 2 \rho(r)\propto r^{-2} )
- 2505.24308v1: Inferring Obscured Cosmic Black Hole Accretion History from AGN Found by JWST/MIRI CEERS Survey
This study presents the black hole accretion history (BHAH) of obscured active galactic nuclei (AGNs) identified from the JWST CEERS survey by Chien et al. (2024) using mid-infrared (MIR) SED fitting. We compute black hole accretion rates (BHARs) to estimate the black hole accretion density (BHAD), $ρ_{L_{\mathrm{disk}}}$, across $0 < z < 4.25$. MIR luminosity functions (LFs) are also constructed for these sources, modeled with modified Schechter and double power law forms, and corresponding BHAD, $ρ_{\mathrm{LF}}$, is derived by integrating the LFs and multiplying by the luminosity. Both $ρ_{\mathrm{LF}}$ extend to luminosities as low as $10^7 \, L_{\odot}$, two orders of magnitude fainter than pre-JWST studies. Our results show that BHAD peaks between redshifts 1 and 3, with the peak varying by method and model, $z \approx 1$--2 for $ρ_{L_{\mathrm{disk}}}$ and the double power law, and $z \approx 2$--3 for the modified Schechter function. A scenario where AGN activity peaks before cosmic star formation would challenge existing black hole formation theories, but our present study, based on early JWST observations, provides an initial exploration of this possibility. At $z \sim 3$, $ρ_{\mathrm{LF}}$ appears higher than X-ray estimates, suggesting that MIR observations are more effective in detecting obscured AGNs missed by X-ray observations. However, given the overlapping error bars, this difference remains within the uncertainties and requires confirmation with larger samples. These findings highlight the potential of JWST surveys to enhance the understanding of co-evolution between galaxies and AGNs.
- 2606.10455v1: The Extreme Quasar Main Sequence of Super-Eddington DESI-DR1 NLSy1 Galaxies
Results. The DESI-DR1 NLSy1 population shows a striking shift toward the extreme end of the EV1 parameter space, possessing stronger Fe II emission (median log R 4570 = − 0.03 \log R_{4570}=-0.03 ) compared to the SDSS sample ( − 0.31 -0.31 ). Furthermore, the DESI sources systematically harbor less massive black holes (median log M BH / M ⊙ ≈ 6.73 \log M_{\text{BH}}/M_{\odot}\approx 6.73 in both calibrations) than the SDSS objects ( 6.77 − 6.91 6.77-6.91 ). Given their comparable continuum luminosities, a consistently larger fraction of the DESI sample (43.8%–47.7%) is pushed across the Eddington limit ( log R E d d > 0 \log R_{Edd}>0 ) compared to the SDSS sample (20.6%–37.4%).
- 2606.10455v1: The Extreme Quasar Main Sequence of Super-Eddington DESI-DR1 NLSy1 Galaxies
In this work, we have utilized the unprecedented sensitivity of the DESI-DR1 survey to identify and characterize a new, large sample of 18,749 Narrow-Line Seyfert 1 galaxies ( DESI Collaboration, 2025 ) . By projecting this sample onto the EV1 parameter space and comparing it against the SDSS-DR17 NLSy1 population ( Paliya et al., 2024 ) , we reach the following conclusions: (1) The DESI-DR1 survey has uncovered a distinct, extreme tail of the quasar main sequence. The DESI-NLSy1 galaxies show stronger Fe II emission (median log R 4570 = − 0.03 ± 0.52 \log R_{4570}=-0.03\pm 0.52 ) compared to previously known SDSS-NLSy1s (median log R 4570 = − 0.31 ± 0.29 \log R_{4570}=-0.31\pm 0.29 ). (2) This EV1 shift is likely to be driven by a population of lower-mass supermassive black holes. The median single-epoch virial mass for the DESI sample is log ( M BH / M ⊙ ) = 6.73 ± 0.42 \log(M_{\text{BH}}/M_{\odot})=6.73\pm 0.42 , significantly lower than the SDSS sample ( log ( M BH / M ⊙ ) = 6.91 ± 0.37 \log(M_{\text{BH}}/M_{\odot})=6.91\pm 0.37 ). (3) Coupling their lower black hole masses with their continuum luminosities reveals that a substantial fraction of the DESI-NLSy1 population (43.8%, compared to 20.6% for SDSS) is accreting at or above the Eddington limit. Although applying the Eddington-dependent Woo et al. (2026) calibration reduces the gap between the two samples (47.7% vs. 37.4%), the overall trend remains consistent, robustly confirming their extreme accretion states.
Abstract
Understanding the complex co-evolution of active galactic nuclei (AGN) and their host galaxies across cosmic time remains a fundamental challenge, particularly in identifying how the physical drivers of galaxy diversity evolve from the early Universe to the present day. To understand this, we use a multi-wavelength JWST catalog of 2,709 sources cross-matched from the SMILES and JWST Advanced Deep Extragalactic Survey (JADES) surveys, spanning lookback times from 0.8 to 12.9 Gyr ($0.05 <z <6$). Using Pearson correlation matrix, we find AGN luminosity ($L_{\mathrm{AGN}}$) strongly correlates ($\sim0.8$) with star formation rate (SFR) and dust luminosity ($L_{\mathrm{dust}}$), weakly correlates ($\sim0.5$) with stellar mass ($M_\star$) and anti-correlates ($\sim -0.4$) with star formation history (SFH) duration and stellar age (Age$_\star$). However, the apparent anti-correlation observed between galaxy age and AGN luminosity is driven by cosmic time rather than by a direct physical connection. Using Principal Component Analysis (PCA), we find that galaxy diversity is fundamentally governed by two principal components: AGN and galaxy activity, and stellar age. At higher redshifts, AGN accretion, star formation, and dust emission are tightly synchronized, reflecting gas-rich conditions in the early Universe. In contrast, the present Universe exhibits a clear bimodal structure in host-dominated systems ($f_{\mathrm{AGN}} \leq 0.2$), separating quiescent and star-forming galaxies. Our results demonstrate that AGN luminosity is primarily governed by the host galaxy's current cold-gas supply, of which recent star formation is a close observational tracer, with galaxy mass setting the overall potential. This highlights a co-evolution scenario in which black hole growth and star formation are tightly linked, particularly at early cosmic epochs.
Discussion
Discussion access requires a security token. Register for the weekly digest.