2606.05301v1 · First listed 2026-06-05
AGN Line-Intensity Mapping: A Probe of Faint Black Holes at Cosmic Noon
Forecasts suggest [Ne V] line-intensity-map–galaxy cross-correlations could statistically recover roughly 10% of cosmic-noon AGN line emission from sources below a CDIM-like direct-detection limit, though inference of the faint emissivity remains luminosity-function dependent. [1][2]
Evidence
This is a forecasting study, not a detection. It models cross-power spectra between [Ne V] intensity maps and galaxy redshift surveys for hypothetical CDIM-like [Ne V] λ3426 and PRIMA-like [Ne V] 14.3 μm experiments, using a Fisher matrix. The main CDIM-like observable is the product of mean [Ne V] intensity and AGN bias, S_NeV b_NeV. At z=3, the displayed cross-spectrum has 1σ error bars; redshift-space distortions are omitted from that plotted spectrum but included in the Fisher analysis. Forecast redshift-space distortions can separate intensity from bias at z=2–3. For the sub-5σ population, the forecast S/N on S_NeV b_NeV is 9 at z=2 and 4 at z=3, becoming undetectable by z=4. [Ne V]'s 97.1-eV ionization potential is presented by the authors as making it an essentially uncontaminated AGN tracer. [1][6][8]
Earlier work
The supplied evidence supports a concrete observational comparison only at the level reported by this paper: its z=3 CDIM-like limit, Lbol≈5×10^43 erg s−1, coincides with the faint end of the cited existing luminosity-function data, whereas at z=2 direct observations extend below the modeled ≈1.5×10^43 erg s−1 limit. Separately, JWST/NIRCam work found [O III]+Hβ ionization-cone morphologies in 6 of 27 known z=2.4–3.4 AGN, establishing resolved narrow-line-region context at similar epochs, but it neither measures [Ne V] LIM nor tests this forecast. [9][22]
What changes
The proposed advance is an aggregate census of faint AGN using a high-ionization narrow line rather than individual detections or stacking. In the CDIM-like model, sources below the 5σ threshold contribute roughly 10% of total [Ne V] intensity at both z=2 and z=3. The threshold rises from ≈1.5×10^43 to ≈5×10^43 erg s−1 over this interval. A complementary dust-insensitive 14.3-μm [Ne V] forecast gives S/N≈6 for the total product and ≈3 for the faint population below Lbol≈10^44 erg s−1 at z=3; the authors propose that the two-line intensity ratio could constrain population-mean dust obscuration. [2][4]
Limits and open questions
All sensitivities depend on assumed future-instrument performance and the adopted AGN/galaxy signal model. The faint-end luminosity-function slope directly affects the below-threshold intensity fraction, so the quoted ≈10% is not model-independent. Intensity–bias separation becomes increasingly difficult above z≈3, and the faint CDIM-like signal is forecast to be undetectable by z=4. Changing the assumed Eddington fraction to 0.1 changes the stated S/N only at the percent level within their model; that robustness does not remove other modeling uncertainties. The claim of an “unbiased census” should therefore be read as a prospective advantage over selection-dependent direct samples, not an achieved census. [2][4][5]
The supplied extraction contains the target paper’s abstract and selected Results/Discussion passages plus figure captions, but not its full assumptions, instrument specifications, luminosity-function parametrization, or Fisher covariance details. The earlier observational luminosity-function study is referenced only indirectly, without a supplied bibliographic source ID.
Key figures
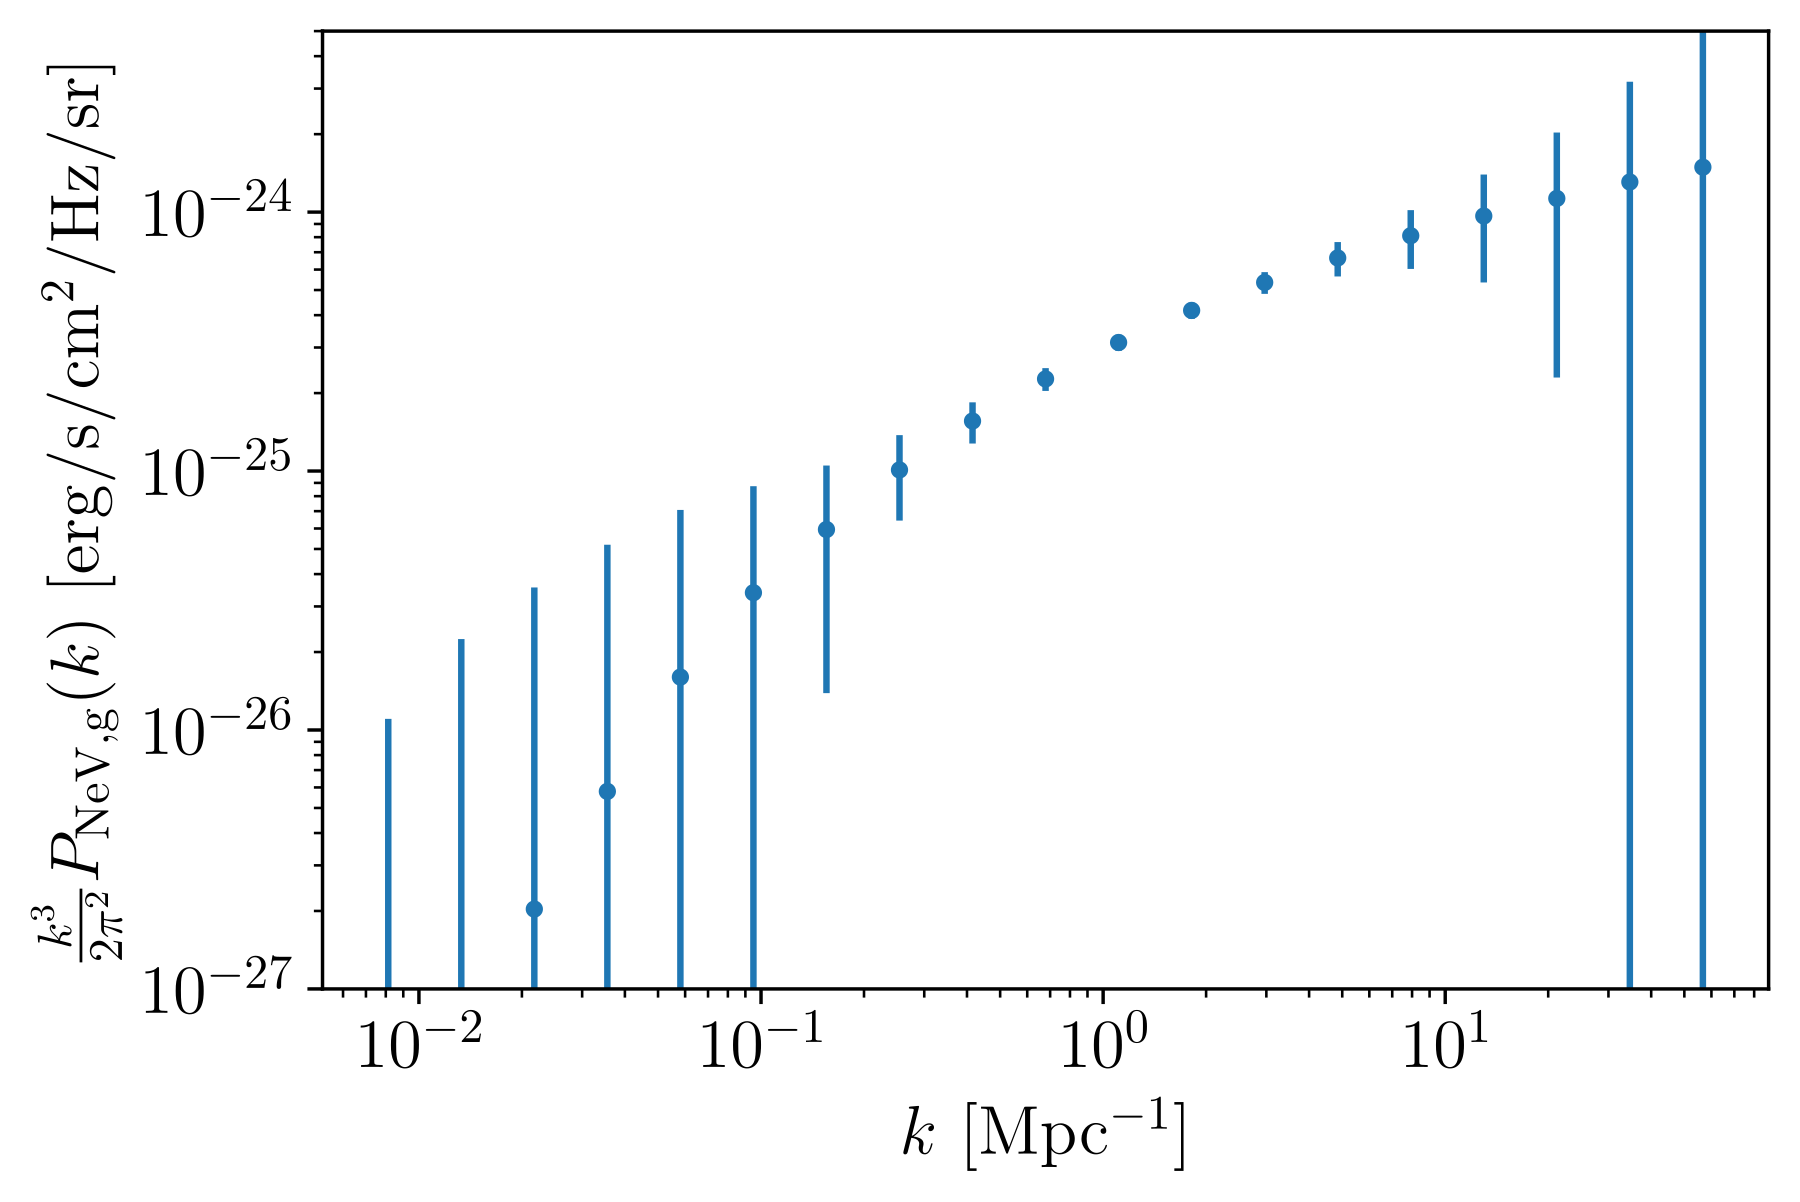
Tests whether the modeled [Ne V]–galaxy cross-power is measurable over Fourier scale k at z=3 for the CDIM-like case. Its points are assumed k-bin centers and its error bars are 1σ; the plotted spectrum deliberately excludes redshift-space distortions.
Original caption
Figure 1: Cross-power spectrum at z = 3 z=3 for a CDIM-like survey targeting [Ne v ] λ 3426 \lambda 3426 . Error bars show the 1 σ 1\sigma uncertainties and data points denote central values of the assumed k-bins. Note that we conservatively do not include redshift-space distortions here, but that they are considered in the Fisher matrix calculation described in the main text.

Tests forecast redshift dependence of S/N on S_NeV b_NeV, contrasting all AGN with only AGN below the CDIM 5σ direct-detection threshold. It exposes the declining faint-only forecast from S/N=9 at z=2 to 4 at z=3.
Original caption
Figure 2: Signal-to-noise on S NeV b NeV S_{\rm NeV}b_{\rm NeV} as a function of redshift for a CDIM-like survey cross-correlating galaxies and [Ne v ] λ 3426 \lambda 3426 . Both the total AGN population (solid line) and the population below the CDIM 5 σ \sigma direct detection limit (dotted line) are shown.

Tests how much mean [Ne V] intensity accumulates below a chosen bolometric-luminosity cut. The marked z=2 and z=3 direct-detection limits both lie above approximately 10% of the cumulative signal, connecting the forecast directly to otherwise individually missed sources.
Original caption
Figure 4: Cumulative fraction of the total [Ne v ] mean intensity S NeV S_{\rm NeV} contributed by AGN below a given bolometric luminosity, L cut L_{\rm cut} , for a CDIM-like survey targeting [Ne v ] λ 3426 \lambda 3426 . The 5 σ \sigma CDIM direct detection thresholds at z = 2 z=2 and z = 3 z=3 are marked with vertical lines, both of which correspond to being above approximately 10% of the cumulative signal.
Related research
Previous digest
Visbal and Bryan propose [Ne V] line-intensity mapping, cross-correlated with galaxy redshift surveys, as a way to recover the cumulative AGN signal at cosmic noon, with the 97.1 eV ionization threshold making [Ne V] an unusually clean tracer of AGN-powered narrow-line emission, including in obscured systems. ([arxiv.org](https://arxiv.org/abs/2606.05301)) For a CDIM-like survey targeting [Ne V] λ3426, they forecast strong constraints on the combined quantity S_NeV b_NeV over z=2-3, and show that redshift-space distortions can separate the mean line intensity from the AGN bias. ([arxiv.org](https://arxiv.org/abs/2606.05301)) The headline result is that LIM stays sensitive below the direct-detection floor: at z=3 the 5σ threshold is L_bol ∼ 5×10^43 erg s^-1, yet about 10% of the total signal comes from fainter AGN and that sub-threshold contribution is still detectable at S/N ≈ 9-4 across z=2-3. ([arxiv.org](https://arxiv.org/abs/2606.05301)) A PRIMA-like [Ne V] 14.3 μm experiment gives slightly lower signal-to-noise but adds a dust-insensitive census of faint, obscured accretion, making AGN LIM a promising route to the total AGN emissivity history and the faint black hole-halo connection. ([arxiv.org](https://arxiv.org/abs/2606.05301))
Sources and evidence (22)
- 2606.05301v1: AGN Line-Intensity Mapping: A Probe of Faint Black Holes at Cosmic Noon
We propose line-intensity mapping (LIM) as a new probe of active galactic nuclei (AGN). By cross-correlating [Ne V] intensity maps with galaxy redshift surveys, we show that the cumulative AGN line emission can be detected even when individual sources are below the detection threshold. The 97.1 eV ionization potential of [Ne V] makes it an essentially uncontaminated tracer of AGN activity, arising from the narrow line region which is accessible even in heavily obscured AGN. We forecast signal-to-noise ratios using a Fisher matrix formalism for two hypothetical future instruments: a CDIM-like instrument targeting [Ne V] $λ3426$ and a PRIMA-like instrument optimized for LIM targeting [Ne V] $14.3 μ$m. For the CDIM-like case we find strong constraints on the product of the mean AGN intensity and bias, $S_{\rm NeV} b_{\rm NeV}$, across $z=2-3$, with redshift-space distortions enabling individual constraints on $S_{\rm NeV}$ and $b_{\rm NeV}$. The LIM signal retains sensitivity to AGN below the $5σ$ direct detection threshold, which at $z=3$ corresponds to $L_{\rm bol} \sim 5\times10^{43}$ erg s$^{-1}$ and coincides with the faint end of existing luminosity function measurements. Roughly 10% of the total signal originates from below this threshold, with the sub-threshold population detectable at $S/N=9-4$ across $z=2-3$ (for $S_{\rm NeV} b_{\rm NeV}$). The PRIMA-like instrument achieves slightly lower signal-to-noise but provides a complementary probe of the AGN population due to the insensitivity of the $14.3 μ$m line to dust attenuation. AGN LIM can potentially be applied to several scientific problems including tracing the total AGN emissivity history, constraining the black hole-halo connection at faint luminosities, and discriminating between supermassive black hole seeding mechanisms.
- 2606.05301v1: AGN Line-Intensity Mapping: A Probe of Faint Black Holes at Cosmic Noon
In Figure 4 we show the cumulative fraction of the total [Ne v ] mean intensity S NeV S_{\rm NeV} contributed by AGN below a given bolometric luminosity. The CDIM direct detection thresholds at z = 2 z=2 and z = 3 z=3 are marked, corresponding to L bol ∼ 1.5 × 10 43 L_{\rm bol}\sim 1.5\times 10^{43} and 5 × 10 43 5\times 10^{43} erg s -1 respectively. In both cases, roughly 10% of the total signal comes from below the detection threshold. The exact fraction depends on the uncertain faint-end slope of the AGN luminosity function, and a measurement of S NeV S_{\rm NeV} would therefore directly constrain the faint-end AGN emissivity in a way that is complementary to and independent of direct detection approaches. This shows that LIM is likely to inform us about the aggregate properties of faint AGN near cosmic noon.
- 2606.05301v1: AGN Line-Intensity Mapping: A Probe of Faint Black Holes at Cosmic Noon
Figure 4: Cumulative fraction of the total [Ne v ] mean intensity S NeV S_{\rm NeV} contributed by AGN below a given bolometric luminosity, L cut L_{\rm cut} , for a CDIM-like survey targeting [Ne v ] λ 3426 \lambda 3426 . The 5 σ \sigma CDIM direct detection thresholds at z = 2 z=2 and z = 3 z=3 are marked with vertical lines, both of which correspond to being above approximately 10% of the cumulative signal.
- 2606.05301v1: AGN Line-Intensity Mapping: A Probe of Faint Black Holes at Cosmic Noon
For the CDIM-like case, the total S/N on S NeV b NeV S_{\rm NeV}b_{\rm NeV} is strong across z = 2 z=2 – 3 3 and declines at higher redshift. Redshift-space distortions enable individual constraints on S NeV S_{\rm NeV} and b NeV b_{\rm NeV} at z = 2 z=2 – 3 3 , with the degeneracy becoming increasingly difficult to break at higher redshift. The key science result is the sensitivity of the LIM signal to AGN below the 5 σ 5\sigma CDIM direct detection threshold. At z = 3 z=3 this threshold corresponds to L bol ∼ 5 × 10 43 L_{\rm bol}\sim 5\times 10^{43} erg s -1 , coinciding with the faint end of the [ 15 ] observational data, and roughly 10% of the total signal originates from below this limit. The sub-threshold population is detectable at S/N of 9 and 4 at z = 2 z=2 and z = 3 z=3 respectively, and becomes undetectable by z = 4 z=4 . Measuring this quantity would provide an unbiased census of sources too faint to appear in any existing survey, free from the selection biases that affect stacking analyses. For the PRIMA-like case we forecast S / N ∼ 6 S/N\sim 6 on S NeV b NeV S_{\rm NeV}b_{\rm NeV} and S / N ∼ 3 S/N\sim 3 on the faint population below L bol ∼ 10 44 L_{\rm bol}\sim 10^{44} erg s -1 at z = 3 z=3 . While the constraints are weaker than the CDIM-like case, the 14.3 μ 14.3\,\mu m line would provide a dust extinction-free view of the AGN population that is complementary to the UV line measurement. In particular, the ratio of S NeV S_{\rm NeV} measured in the two lines provides a direct probe of the mean dust obscuration in the host galaxy interstellar medium, averaged over the full population including faint and obscured sources that are inaccessible to direct observation.
- 2606.05301v1: AGN Line-Intensity Mapping: A Probe of Faint Black Holes at Cosmic Noon
We note that the exact accretion rate assumed does not strongly impact our results. Reducing the assumed Eddington fraction to λ Edd = 0.1 \lambda_{\rm Edd}=0.1 only improves our signal-to-noise at the percent level. This is because the halos which contribute to the signal are at masses where the clustering bias does not change rapidly as a function of halo mass.
- 2606.05301v1: AGN Line-Intensity Mapping: A Probe of Faint Black Holes at Cosmic Noon
We begin by forecasting results for AGN LIM with the [Ne v ] λ 3426 \lambda 3426 line observed with our CDIM-like instrument where we have conservatively ignored redshift-space distortions by setting μ = 0 \mu=0 . In Figure 1 we present the cross-power spectrum P NeV , g P_{\rm NeV,g} as a function of wavenumber k k at z = 3 z=3 along with the associated 1 σ 1\sigma error bars. We predict high signal-to-noise across a wide range of scales.
- 2606.05301v1: AGN Line-Intensity Mapping: A Probe of Faint Black Holes at Cosmic Noon
Figure 1: Cross-power spectrum at z = 3 z=3 for a CDIM-like survey targeting [Ne v ] λ 3426 \lambda 3426 . Error bars show the 1 σ 1\sigma uncertainties and data points denote central values of the assumed k-bins. Note that we conservatively do not include redshift-space distortions here, but that they are considered in the Fisher matrix calculation described in the main text.
- 2606.05301v1: AGN Line-Intensity Mapping: A Probe of Faint Black Holes at Cosmic Noon
We show in Figure 2 the signal-to-noise on S NeV b NeV S_{\rm NeV}b_{\rm NeV} as a function of redshift for both the total signal and the contribution from AGN below the 5 σ \sigma CDIM detection threshold. The total S/N is strong across z = 2 z=2 – 3 3 and falls toward higher redshift, driven by a combination of the declining AGN luminosity function and increased cosmological luminosity distance. For the faint-only contribution, the S/N is 9 at z = 2 z=2 , 4 at z = 3 z=3 , and undetectable by z = 4 z=4 .
- 2606.05301v1: AGN Line-Intensity Mapping: A Probe of Faint Black Holes at Cosmic Noon
We note that at z = 3 z=3 the CDIM detection threshold for [Ne v ] λ 3426 \lambda 3426 corresponds to an AGN luminosity of L bol ∼ 5 × 10 43 L_{\rm bol}\sim 5\times 10^{43} erg s -1 . This coincides both with the faint end of the [ 15 ] observational data and thus would probe sources which are currently too faint to study. At z = 2 z=2 the situation is somewhat different. CDIM can detect sources only down to L bol ∼ 1.5 × 10 43 L_{\rm bol}\sim 1.5\times 10^{43} erg s -1 , while [ 15 ] have direct observational support to even lower luminosities, so the LIM measurement at z = 2 z=2 is probing a population that is faint but has contribution from detectable sources.
- 2606.05301v1: AGN Line-Intensity Mapping: A Probe of Faint Black Holes at Cosmic Noon
Figure 2: Signal-to-noise on S NeV b NeV S_{\rm NeV}b_{\rm NeV} as a function of redshift for a CDIM-like survey cross-correlating galaxies and [Ne v ] λ 3426 \lambda 3426 . Both the total AGN population (solid line) and the population below the CDIM 5 σ \sigma direct detection limit (dotted line) are shown.
- 2503.05537v1: Little Red Dots as the Very First Activity of Black Hole Growth
Figure 2: Left : The redshift dependence of the AGN comoving number density. Each modeled curve presents the AGN population that undergo n n -th AGN active episodes, illustrating the distribution of the total elapsed time T n T_{n} ( 1 ≤ n ≤ 8 1\leq n\leq 8 ): the first (magenta), second (green), third (cyan), fourth (orange) episodes, as well as the total population in this model (black). The normalization is set such that the modeled LRD abundance is consistent with the observed ones [ 26 , 25 , red symbols,] . The total AGN predicted in this model agrees with measurements of AGN abundances in the range 0 < z < 5 0<z<5 [ 46 , gray symbols,] . Right : The fraction of non-LRDs (black solid; model) and observational constraints on the fraction (95% confidence level) derived from a sample of 53 broad-line AGNs [ 44 , blue symbol,] . The shaded region indicates the range of uncertainty due to the choice of the absolute time origin for the LRD occurrence distribution.
- 2503.05537v1: Little Red Dots as the Very First Activity of Black Hole Growth
In the right panel of Figure 2 , we show the fraction of AGNs that have experienced their second or later episodes relative to the total AGN population, representing the fraction of non-LRDs under this hypothesis. Since a significant fraction of BHs undergo a second episode at z < 5 z<5 , this fraction increases rapidly and reaches unity by z ∼ 3 z\sim 3 . For comparison, we overlay observational constraints on the fraction of unobscured (non-LRD) AGNs (95% confidence level), derived from a sample of 53 spectroscopically confirmed broad-line AGNs in the redshift range of 3.5 < z < 6 3.5<z<6 [ 44 ] . At z ≤ 6 z\leq 6 , the sample size in each redshift bin is sufficiently large to reveal a trend that closely follows the model prediction (black solid) 2 2 2 Since the sample size at 6 < z < 7 6<z<7 is too small for robust statistical analysis (one LRD and two unobscured AGNs), we do not include the data in the right panel of Figure 2 . Statistical uncertainties are evaluated using the Clopper‐Pearson method. .
- 2510.06325v1: Preferential Accretion onto the Secondary Black Hole Strengthens Gravitational Wave Signals
To add an observational constraint on the amount of SMBH mass growth due to accretion during the merger, we apply the results of [ 33 ] . Their observational samples are a catalog of galaxy pairs in SDSS (selected in the same way as the SDSS pairs used to determine the galaxy merger rate in Section II.1 ) and a catalog of post-coalescence mergers from the Ultraviolet Near Infrared Optical Northern Survey. Using these samples, they integrate star formation rate enhancements in merging galaxies to estimate the amount of new stellar mass created by star formation during a galaxy merger. They find that the total cumulative stellar mass growth during a galaxy merger is 10 % 10\% for massive galaxies (log ( OPEN M ∗ / M ⊙ ) ∼ > 10.5 M_{*}/M_{\odot})\mathrel{\hbox to0.0pt{\lower 3.0pt\hbox{$\mathchar 536$}\hss}\raise 2.0pt\hbox{$\mathchar 318$}}10.5 ), and can be over 20 % 20\% for less massive systems [ 33 ] . Using the relationship from Equation 4 , a 10 % 10\% growth in stellar mass becomes a 15 % 15\% growth in SMBH mass. Because of the uncertainties in the scaling relations behind Equation 4 , we explore both 10 % 10\% and 20 % 20\% SMBH mass growth per merger. This is a conservative first step in exploring the impact of differential accretion, as the actual amount of SMBH mass growth may be higher for lower mass galaxies (as described above) and higher redshift galaxies.
- 2510.06325v1: Preferential Accretion onto the Secondary Black Hole Strengthens Gravitational Wave Signals
The [ 33 ] results are based on a sample of z < 0.3 z<0.3 galaxies, whereas our model of SMBH mergers extends to z = 1.5 z=1.5 . Galaxy gas fractions and SMBH accretion rates are known to increase with redshift (e.g., L. J. Tacconi et al. 86 , G. Yang et al. 97 , F. Zou et al. 100 ), making the [ 33 ] result of 10 − 20 % 10-20\% cumulative stellar mass growth at z < 0.3 z<0.3 a lower limit for our 0 < z < 1.5 0<z<1.5 galaxy sample.
- 2504.00172v1: Evidence for evolutionary pathway-dependent black hole scaling relations
Recent observations have identified an abundance of high-redshift active galactic nuclei (AGN) with supermassive black holes (BHs) that are over-massive compared to the local BH mass$-$total stellar mass ($M_{\mathrm{BH}}-M_\star$) relation. $M_{\mathrm{BH}}$ measurements at high-$z$ are critical for probing the growth histories of BHs and their host galaxies, including BH seeding and evolution of the $M_{\mathrm{BH}}-M_\star$ relation. However, BH masses in high-$z$ AGN are generally estimated from single-epoch measurements, which are anchored to local relations based on reverberation mapping and carry large systematic uncertainties. Alternate $M_{\mathrm{BH}}$ detection methods such as dynamical measurements are more reliable but currently only possible in the local Universe or with strongly lensed systems. Recently, dynamical $M_{\mathrm{BH}}$ measurements were made in a $z\sim2$ lensed quiescent galaxy as well as a sample of six local galaxies identified as likely relics of common quiescent red nugget galaxies at cosmic noon. We compare the $z\sim2$ red nugget and relic BHs to recent results for $4<z<11$ AGN, quasars, and Little Red Dots. Intriguingly, the $z\sim2$ galaxy and local relic galaxies all lie on both the local $M_{\mathrm{BH}}-M_\star$ relation for bulges and the $4<z<7$ $M_{\mathrm{BH}}-M_\star$ relation. Our results suggest the $M_{\mathrm{BH}}-M_\star$ relation for bulges was likely in place at high-$z$ and indicate careful consideration of different evolutionary pathways is needed when building BH scaling relations. While improvements to $M_{\mathrm{BH}}$ estimates in AGN will increase our confidence in high-$z$ BH masses, detecting BHs in relic galaxies and lensed galaxies presents a complementary probe of the high-$z$ relations.
- 2504.03848v1: Large-scale surveys of the quasar proximity effect
(b) We have extracted a sample of quasars from the Astrid simulation at z = 3 z=3 with bolometric luminosities from 10 45 erg s − 1 10^{45}\,\mathrm{erg}\,\mathrm{s}^{-1} to 10 47 erg s − 1 10^{47}\,\mathrm{erg}\,\mathrm{s}^{-1} . We find relationships between host halo mass and quasar luminosity as well as host halo mass and black hole mass, with both having substantial scatter (0.1-0.4 dex). The quasar-matter cross-correlation can be fit well using the halo model, with brightest quasars in Astrid ( L ∼ 10 47 L\sim 10^{47} ergs -1 ) having a linear bias of b q = 4 b_{\rm q}=4 .
- 2504.03848v1: Large-scale surveys of the quasar proximity effect
(c) We have tested our proximity effect halo model using the Ly α \mathrm{Ly}\alpha forest from Astrid , finding that we can fit for the b q b_{\rm q} and r eq r_{\rm eq} parameters. The radius of equality between local and background ionizing radiation, r eq r_{\rm eq} , is a measure which is directly related to the observable, the radial variation of transmitted flux in Ly α \mathrm{Ly}\alpha forest spectra. The confidence contours of the fit are surprisingly independent between the two parameters. We can fit r eq r_{\rm eq} with 25-50% accuracy for individual quasars, depending on their luminosity. We also find that we could constrain the host halo mass from the fitted b q b_{\rm q} parameter at the ∼ \sim 10% level for averages over samples of 200 quasars.
- 2510.13977v1: The THESAN-ZOOM project: The Hidden Neighbours of OI Absorbers during Reionization
Metal absorbers represent a powerful probe of galaxy feedback and reionization, as highlighted by both observational and theoretical results showing an increased abundance of low-ionised metal species at higher redshifts. The origin of such absorbers is currently largely unknown because of the low number of galaxy counterparts detected, suggesting that they might be surrounded by low-mass faint sources below the current detection threshold. We use the THESAN-ZOOM radiation hydrodynamic simulations to investigate the connection between properties of neutral oxygen (OI) absorbers and galaxies across redshift $z = 5 - 8$. We find that the virialised gas in haloes becomes progressively ionised with cosmic time, leading to a decrease of $\approx 0.2$ in the covering fraction of neutral oxygen, while the total oxygen covering fraction remains constant. Comparing the OI line density obtained from our covering fractions with the trend suggested by blind quasar observations, we determine that the observable absorbers ($N_{\rm OI} \gtrsim 10^{13}\,\text{cm}^{-2}$) are not confined to haloes: at $z \geq 5$ the majority ($\gtrsim 60\%$) arise beyond $R_{\rm{vir}}$, consistent with recent JWST results. Close to OI absorbers, low-mass galaxies ($M_\star \leq 10^8\,\rm{M}_\odot$) are more commonly found, while, depending on the simulated environment, we do not exclude the possibility of nearby more massive star-forming sources ($\geq 5\,\text{M}_\odot\,\text{yr}^{-1}$) similar to those suggested by the latest ALMA observations. These results establish OI absorbers as sensitive tracers of the evolving ionisation structure around faint galaxies to be probed by forthcoming deep spectroscopic surveys.
- 2603.15736v1: Halo assembly bias in the early Universe: a clustering probe of the origin of the Little Red Dots
Overall, we conclude that halo assembly bias persists into the early Universe, albeit with a reduced amplitude relative to later times. This underscores the importance of accounting for secondary bias when inferring halo masses of high- z z galaxies from clustering measurements. Neglecting assembly bias may lead to systematic offsets in halo mass estimates of up to 1 dex.
- 2603.15736v1: Halo assembly bias in the early Universe: a clustering probe of the origin of the Little Red Dots
Overall, we can safely conclude that the SIDM scenario features the lowest halo-mass distributions among the different scenarios considered here. Interestingly, the secondary bias associated with early formation and high concentration largely cancels out.
- 2511.01344v1: BALNet: Deep Learning-Based Detection and Measurement of Broad Absorption Lines in Quasar Spectra
Broad absorption line (BAL) quasars serve as critical probes for understanding active galactic nucleus (AGN) outflows, black hole accretion, and cosmic evolution. To address the limitations of manual classification in large-scale spectroscopic surveys - where the number of quasar spectra is growing exponentially - we propose BALNet, a deep learning approach consisting of a one-dimensional convolutional neural network (1D-CNN) and bidirectional long short-term memory (Bi-LSTM) networks to automatically detect BAL troughs in quasar spectra. BALNet enables both the identification of BAL quasars and the measurement of their BAL troughs. We construct a simulated dataset for training and testing by combining non-BAL quasar spectra and BAL troughs, both derived from SDSS DR16 observations. Experimental results in the testing set show that: (1) BAL trough detection achieves 83.0% completeness, 90.7% purity, and an F1-score of 86.7%; (2) BAL quasar classification achieves 90.8% completeness and 94.4% purity; (3) the predicted BAL velocities agree closely with simulated ground truth labels, confirming BALNet's robustness and accuracy. When applied to the SDSS DR16 data within the redshift range 1.5<z<5.7, at least one BAL trough is detected in 20.4% of spectra. Notably, more than a quarter of these are newly identified sources with significant absorption, 8.8% correspond to redshifted systems, and some narrow/weak absorption features were missed. BALNet greatly improves the efficiency of large-scale BAL trough detection and enables more effective scientific analysis of quasar spectra.
- 2501.05512v1: JWST NIRCam simulations and observations of AGN ionization cones in cosmic noon galaxies
The extended narrow line region (NLR) of Active Galactic Nuclei (AGN) provides a valuable laboratory for exploring the relationship between AGN and their host galaxies, often appearing as an "ionization cone" that can extend out to the very edge of the galaxy. We use new James Webb Space Telescope (JWST) NIRCam imaging to study the morphologies and sizes of NLRs traced by [O III] at cosmic noon ($z\sim2-3$). To determine NIRCam's ability to probe the properties of the NLR in cosmic noon galaxies, we present simulated images of AGN at $z=2-3$ created with archival data cubes from the Multi Unit Spectroscopic Explorer (MUSE) of nine nearby ($z<0.05$) AGN host galaxies with previously confirmed extended NLRs. Our simulated images show that NIRCam is able to resolve the morphologies of NLRs at $z=2-3$ with narrow- and medium-band observations. We then search for extended NLRs with NIRCam medium-band observations targeting the [O III]$+\mathrm{H}β$ emission in twenty-seven previously identified AGN at $z=2.4-3.4$ in the Great Observatories Origins Deep Survey South (GOODS-S) field. We detect six galaxies in our observed sample with [O III]$+\mathrm{H}β$ morphologies consistent with AGN ionization cones with characteristic NLR sizes of $1-2.5$ kpc. Thanks to our simulated data, we can predict the effects of cosmological surface brightness dimming and instrument noise on the NLR size measurements at high redshift, which has the biasing effect of lowering the NLR size-AGN luminosity trend that is observed at low redshift by a factor of $\sim 2$.
Abstract
We propose line-intensity mapping (LIM) as a new probe of active galactic nuclei (AGN). By cross-correlating [Ne V] intensity maps with galaxy redshift surveys, we show that the cumulative AGN line emission can be detected even when individual sources are below the detection threshold. The 97.1 eV ionization potential of [Ne V] makes it an essentially uncontaminated tracer of AGN activity, arising from the narrow line region which is accessible even in heavily obscured AGN. We forecast signal-to-noise ratios using a Fisher matrix formalism for two hypothetical future instruments: a CDIM-like instrument targeting [Ne V] $λ3426$ and a PRIMA-like instrument optimized for LIM targeting [Ne V] $14.3 μ$m. For the CDIM-like case we find strong constraints on the product of the mean AGN intensity and bias, $S_{\rm NeV} b_{\rm NeV}$, across $z=2-3$, with redshift-space distortions enabling individual constraints on $S_{\rm NeV}$ and $b_{\rm NeV}$. The LIM signal retains sensitivity to AGN below the $5σ$ direct detection threshold, which at $z=3$ corresponds to $L_{\rm bol} \sim 5\times10^{43}$ erg s$^{-1}$ and coincides with the faint end of existing luminosity function measurements. Roughly 10% of the total signal originates from below this threshold, with the sub-threshold population detectable at $S/N=9-4$ across $z=2-3$ (for $S_{\rm NeV} b_{\rm NeV}$). The PRIMA-like instrument achieves slightly lower signal-to-noise but provides a complementary probe of the AGN population due to the insensitivity of the $14.3 μ$m line to dust attenuation. AGN LIM can potentially be applied to several scientific problems including tracing the total AGN emissivity history, constraining the black hole-halo connection at faint luminosities, and discriminating between supermassive black hole seeding mechanisms.
Discussion
Discussion access requires a security token. Register for the weekly digest.