2610.10117v1 · First listed 2026-10-08
MUSE-ALMA Haloes XVI: a census of the condensed baryons in z~0.5 HI absorption-selected galaxies
Across 79 H I absorber-selected galaxies at 0.2<z<1.2, the authors combine multiwavelength data to inventory stars and cold gas, finding broadly consistent indirect H I estimators at small impact parameter but environmentally driven scatter and mass-dependent gas fractions. [1][5]
Evidence
The sample contains 79 gas-rich galaxies near strong Lyα absorbers, at projected separations of roughly 5–270 kpc and velocity separations up to 500 km s⁻¹. HST spectroscopy characterizes absorbers; HST imaging and MUSE trace stellar and ionized-gas properties; ALMA targets CO(2–1), CO(3–2), or CO(4–3), with 0.16 mJy beam⁻¹ rms per 50 km s⁻¹. H I is not directly measured: the adopted estimate uses g−r colour and stellar mass, then is compared with an absorber-based estimate using N_HI and b. The authors report a correlation for b≲100 kpc, with large scatter linked to local overdensity. They also find that molecular gas fraction falls more steeply with stellar mass than atomic gas fraction; the proposed consumption/conversion interpretations are not uniquely established by the correlation. [1][2][5]
Earlier work
Figure 1 places the inferred H I–stellar-mass relation beside local xGASS, H I-stacking measurements at z≈0.4 and z≈1, and 21-cm measurements for absorber-selected galaxies at z<0.14. This is a useful but heterogeneous comparison: unlike the present optical/absorber-based H I estimates, the Kulkarni et al. points are 21-cm measurements. For molecular gas, comparison samples differ in CO-to-H₂ conversion: MUSE–ALMA Haloes, xGASS and PHIBSS use metallicity-dependent α_CO, whereas others use a fixed Galactic value, which can systematically shift H₂ masses and molecular fractions. [9][3]
What changes
The paper’s contribution is a joint, absorber-selected census connecting inferred atomic gas, CO-based molecular gas, stellar mass, and inner dynamical masses. Dynamical masses within 2R_e are derived from MUSE ionized-gas rotation and dispersion, with asymmetric-drift correction and HST Sérsic radii. The authors further report higher baryon fractions at high stellar surface density and discuss either feedback-related inner dark-matter-profile changes or aperture-dependent kinematic sampling. Figure 4 directly tests agreement between the two indirect H I estimators, while Figure 5 tests how atomic and molecular gas-to-stellar mass ratios vary with stellar mass. [1][10][5]
Limits and open questions
Selection on strong Lyα absorbers and non-uniform MUSE depth limit generalization to typical galaxies; reported r-band limits span 23.2–26.5. The H I results are estimates rather than 21-cm detections, and environmental effects are explicitly important. The inner baryon-fraction calculation excludes H I because it is assumed extended: its median contribution is estimated as ~5% of dynamical mass within 2R_e, but rises to ~27% below M_dyn=10¹⁰ M⊙. CO non-detections and SFR upper limits occur in the property compilation, while α_CO choices add systematic uncertainty. Figure 7 tests redshift-dependent inner dark-matter fractions, but its baryon apertures differ between this sample (2R_e) and literature samples (R_e). [8][4][6][3]
Evidence includes the target abstract plus extracted HTML passages and figure captions; supplied excerpts do not provide fitted slopes, scatter values, CO detection counts, or per-galaxy measurement uncertainties.
Key figures
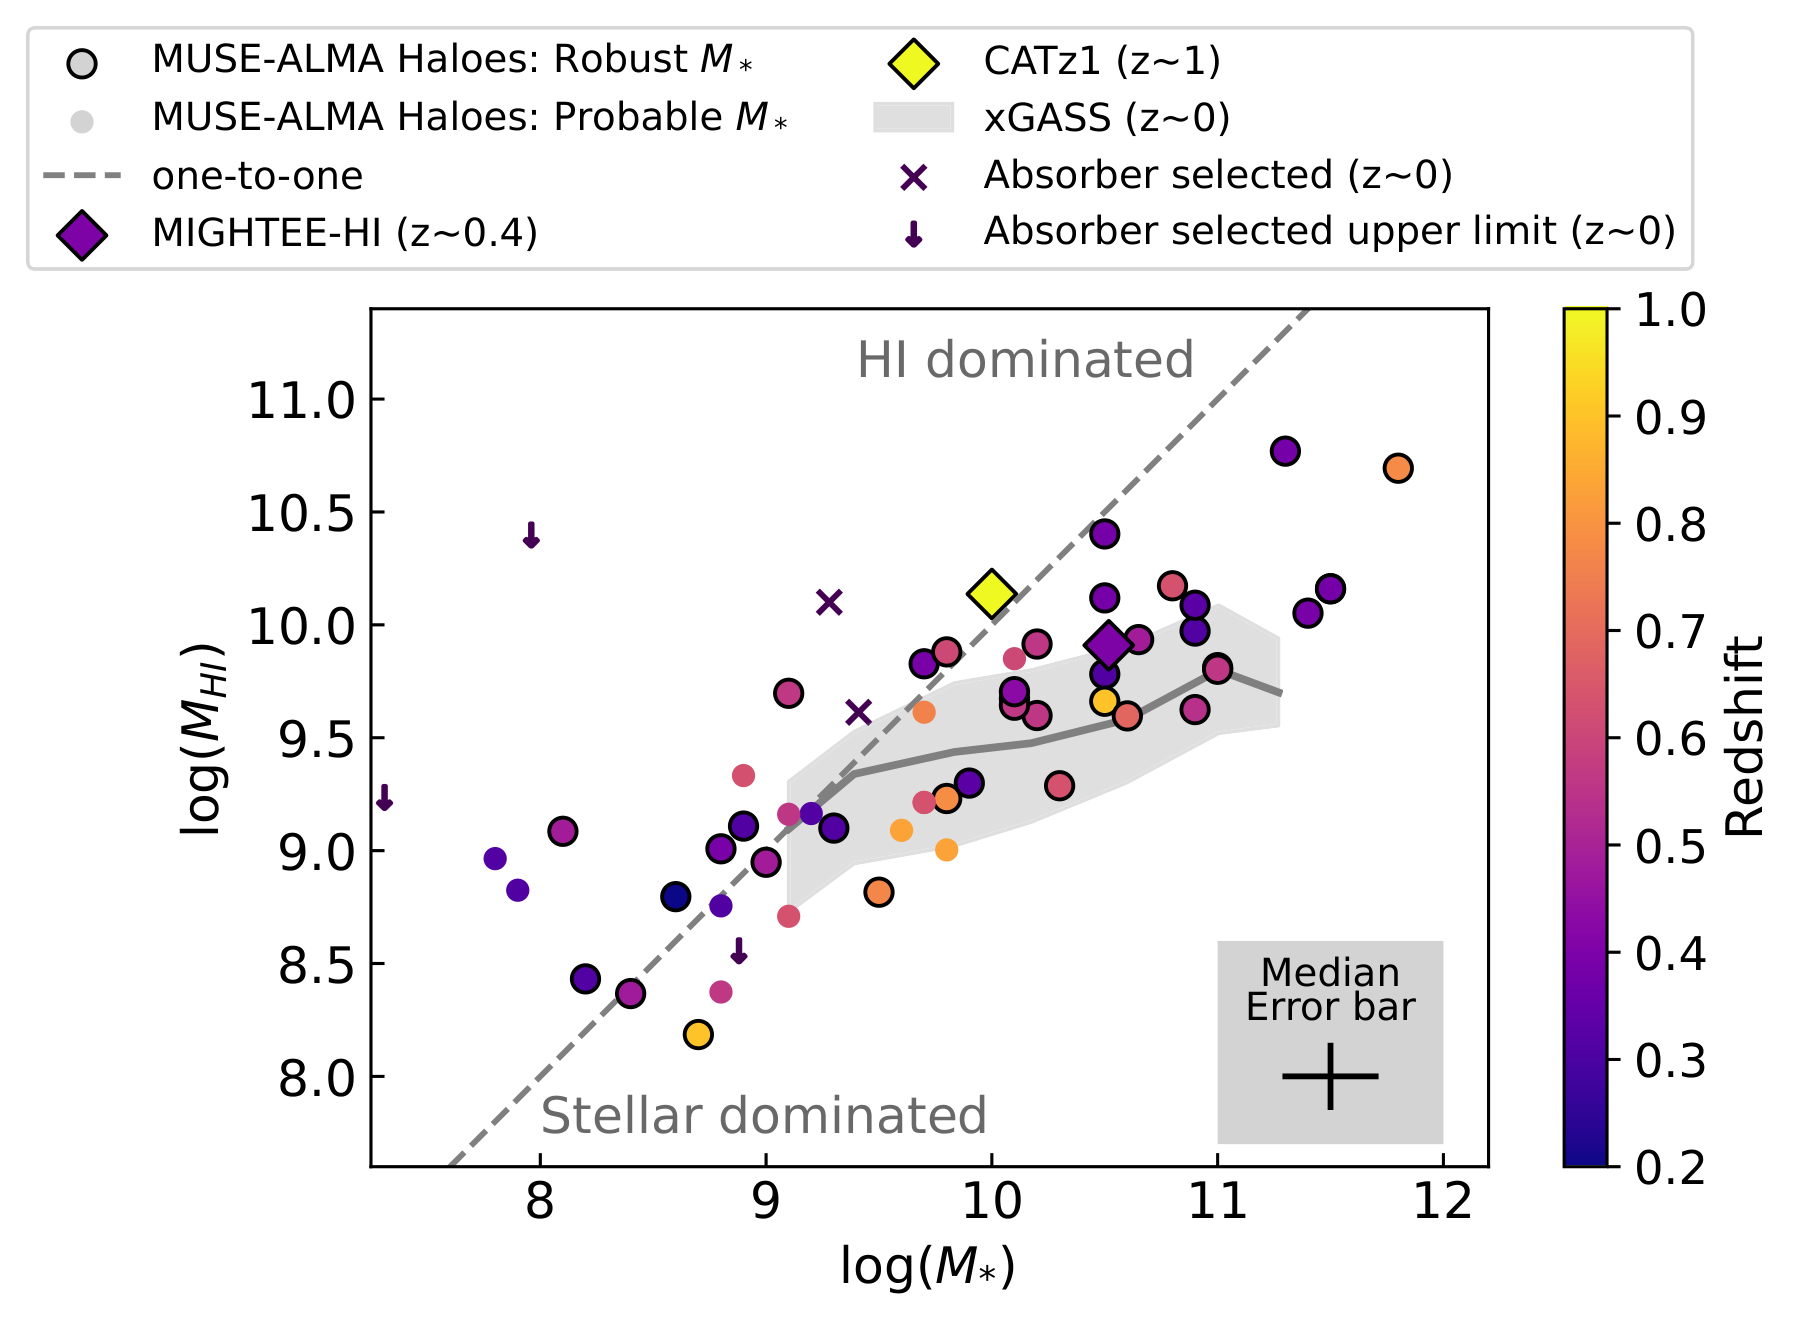
Tests the inferred H I mass–stellar-mass relation against local xGASS, intermediate-redshift stacking, and low-redshift absorber-selected 21-cm measurements.
Original caption
Figure 1 : Estimated H i mass as a function of stellar mass. The MUSE-ALMA Haloes galaxies are shown as circles, coloured from yellow to purple by their redshift. The diamond markers show the H i stacking results from Sinigaglia et al. (2024) at z ∼ 0.4 z\sim 0.4 and Chowdhury et al. (2022) at z ∼ 1 z\sim 1 . The grey shaded region and solid line shows the interquartile range and rolling median of the ( z ∼ 0 z\sim 0 ) xGASS sample for comparison. The ‘ × \times ’ markers and arrows show the absorber-selected z < 0.14 z<0.14 sample from Kulkarni et al. (2022) with 21cm H i measurements.
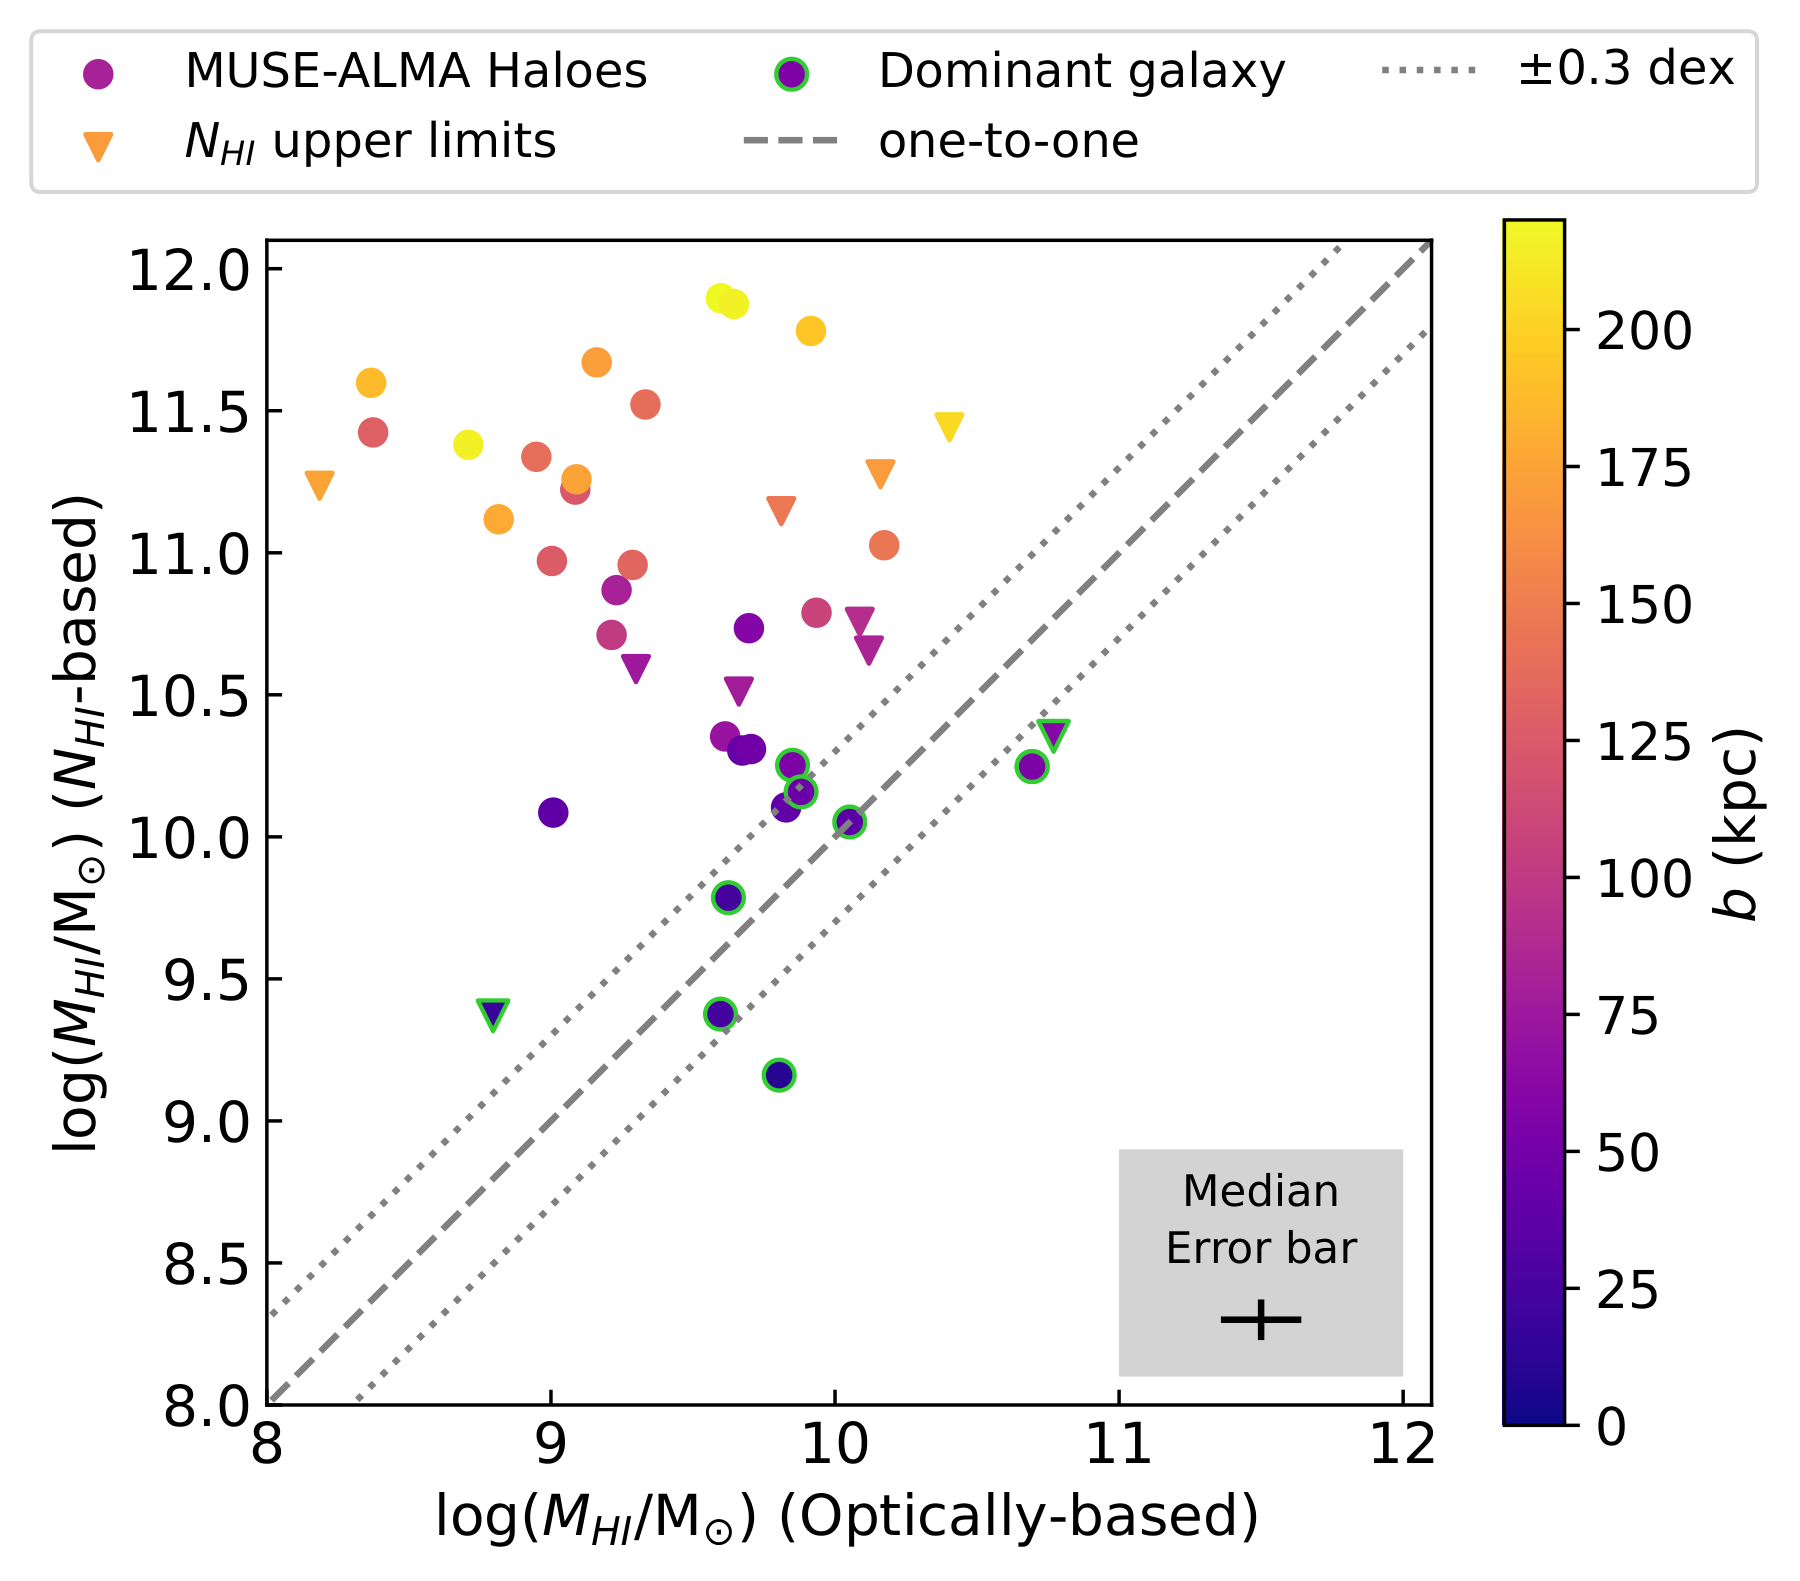
Tests consistency of optical-property and absorber-property H I scaling estimates; the authors identify a small-impact-parameter correlation but large environment-dependent scatter.
Original caption
Figure 4 : Comparison of H i masses estimated using scaling relations of local resolved galaxies. H i masses are estimated using optical properties following the method of Zu (2020) , which uses g − r g-r and M ∗ M_{*} , and using H i absorber properties following the method of Wang et al. (2026) , which uses N HI N_{\rm HI} and b b .
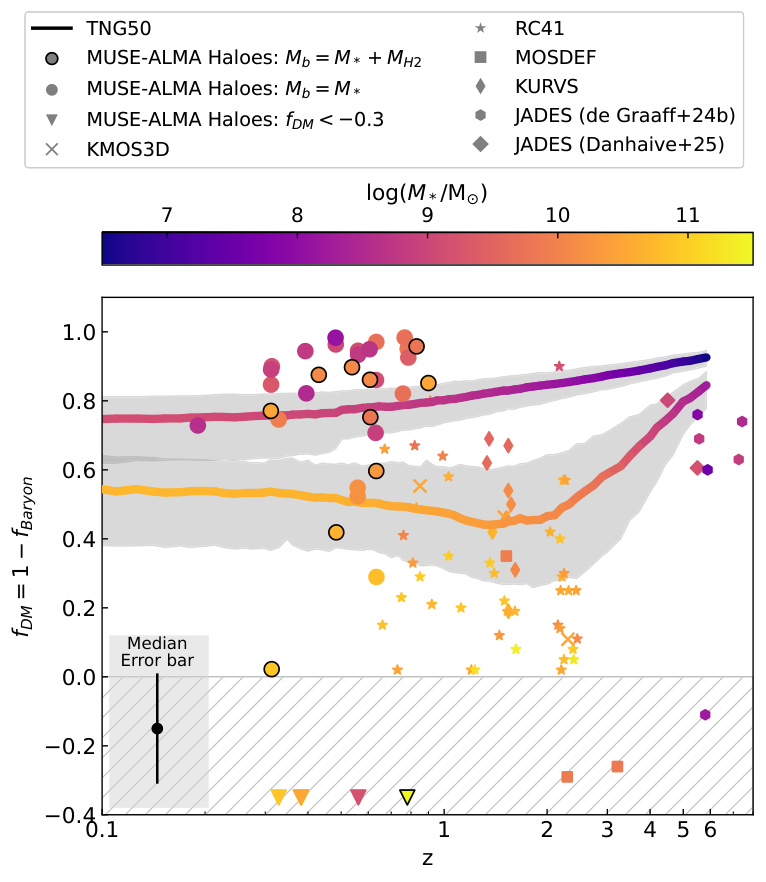
Tests inferred inner dark-matter fraction versus redshift against galaxy surveys and TNG50 analogues, while displaying the aperture mismatch among samples.
Original caption
Figure 7 : The dark matter fraction ( 1 − 1- baryon fraction) as function of redshift, adapted from de Graaff et al. (2024a) . Baryon fractions are measured within 2 R e R_{e} for MUSE–ALMA Haloes and R e R_{e} for literature samples. MUSE-ALMA Haloes sources that were detected in CO have a baryon mass that includes both stellar mass and molecular gas mass, and are shown by the markers with a black outline. For those not detected in CO, the stellar mass is assumed to dominate the baryon mass. Observational data of ‘typical’ star-forming galaxies around cosmic noon are shown: KMOS 3D ( Wuyts et al., 2016 ) , RC41 ( Genzel et al., 2020 ) , MOSDEF ( Price et al., 2020 ) , and KURVS ( Puglisi et al., 2023 ) and at higher redshift: JADES ( de Graaff et al., 2024b ; Danhaive et al., 2025 ) . Median values are shown for the KMOS 3D and JADES ( Danhaive et al., 2025 ) samples within several redshift bins. The redshift evolution of the dark matter fraction within 2 R e 2R_{e} for galaxy analogues in TNG50 is shown by the solid lines, coloured by stellar mass. The lower line shows analogues of dark matter–dominated low-mass galaxies observed with JWST at z ∼ 6 z\sim 6 evolved to z = 0 z=0 , while the upper line shows analogues of the MUSE-ALMA Haloes galaxies selected at z ∼ 0.5 z\sim 0.5 with 8.75 < log ( M ⋆ / M ⊙ ) < 9.25 8.75<\log(M_{\star}/M_{\odot})<9.25 . The grey shaded regions show the 16th–84th percentiles. The unphysical parameter space, where the baryon mass exceeds the total mass, is marked by the grey hashed regions.
Related research
Previous digest
This MUSE-ALMA Haloes census combines HST absorber spectroscopy and imaging with MUSE ionised-gas and ALMA CO data for 79 galaxies at 0.2<z<1.2 selected near strong H I Ly-alpha absorbers, mapping their condensed baryons from inner discs to the CGM. Optical-property H I estimates broadly match absorber-based estimates inside 100 kpc, while molecular gas fractions fall more steeply with stellar mass than atomic-gas fractions, consistent with faster stellar build-up relative to the cold-gas reservoir. High stellar-surface-density galaxies have the largest inner baryon fractions, and comparison with TNG50 suggests that only a few could be baryon-dominated descendants of low-mass z~6 JWST galaxies; many are instead more dark-matter-dominated systems whose progenitors would fall below JWST detection limits.
Sources and evidence (25)
- 2610.10117v1: MUSE-ALMA Haloes XVI: a census of the condensed baryons in z~0.5 HI absorption-selected galaxies
We use the MUSE-ALMA Haloes sample to build a census of the condensed baryons (stars and cold gas) to study the multiphase interstellar medium and circumgalactic medium (CGM). The sample includes 79 gas-rich galaxies at 0.2<z<1.2 located near strong HI Ly-alpha absorbers along quasar sightlines within projected separations of ~5-270 kpc and radial velocity separations of up to 500 km/s. HST spectroscopy characterises the absorbers, while HST imaging, MUSE and ALMA observations trace the stars, ionised gas and molecular gas. We find the following results. (i) HI masses inferred from optical properties show broad agreement with those derived from the CGM absorber properties for impact parameters <100 kpc, although group environments can significantly influence these estimates. (ii) The molecular gas fraction declines more steeply with stellar mass than the HI fraction. This suggests that stars build up more rapidly than the cold gas reservoir, while massive galaxies either consume their molecular gas more efficiently or convert HI into H2 less efficiently. (iii) Galaxies with high stellar surface densities exhibit the highest baryon fractions. This may reflect baryonic feedback, which can produce flatter inner dark matter profiles in high surface density systems, or aperture effects, where the ionised gas kinematic tracer probes only the innermost, baryon-dominated regions in compact sources, but extends further into the dark matter halo in sources with extended baryonic distributions. (iv) A few galaxies are consistent with being the baryon-dominated descendants of the low mass z~6 galaxies detected by JWST, while many appear to be substantially more dark matter dominated, lower mass systems with progenitors beyond JWST detection limits. This study provides a multiscale, multiphase view of the gas in and around galaxies, allowing us to probe the baryon budget across cosmic time.
- 2610.10117v1: MUSE-ALMA Haloes XVI: a census of the condensed baryons in z~0.5 HI absorption-selected galaxies
The large programme targeted CO emission lines ( CO(2-1), CO(3-2), CO(4-3) ) using Band 4 (125 - 163 GHz) and Band 6 (211 - 275 GHz). To maximise the schedulability of the programme, the allowed range of spatial resolution was set to 0.57-1.02 arcsec, which resulted in observations being carried out in configurations C-2, C-3 or C-4. Data reduction was performed using the standard ALMA pipeline and CASA (version 6.5.6), reaching an rms sensitivity of 0.16 mJy beam -1 over 50 km s -1 .
- 2610.10117v1: MUSE-ALMA Haloes XVI: a census of the condensed baryons in z~0.5 HI absorption-selected galaxies
For the MUSE-ALMA Haloes sample, we adopt a Chabrier (2003) initial mass function (IMF), while the literature comparison samples adopt either Chabrier (2003) or Kroupa (2001) IMFs. The resulting differences in stellar mass estimates are small ( Madau and Dickinson, 2014 , ∼ 0.03 \sim 0.03 dex;) and are not expected to significantly affect the comparison. MUSE-ALMA Haloes, xGASS, and PHIBSS all use metallicity-dependent α CO \alpha_{\rm CO} prescriptions to estimate M H 2 M_{\rm H_{2}} , whereas the remaining comparison samples assume a fixed Galactic α CO \alpha_{\rm CO} . The choice of α CO \alpha_{\rm CO} can therefore introduce systematic offsets in the derived M H 2 M_{\rm H_{2}} values and molecular gas fractions.
- 2610.10117v1: MUSE-ALMA Haloes XVI: a census of the condensed baryons in z~0.5 HI absorption-selected galaxies
We do not include H i in the inner baryon mass budget. While H i makes up a significant baryon component, it typically resides in an extended reservoir beyond the visible disc, as shown in Sect. 4 . As a result, its contribution within the inner regions probed by our dynamical measurements is expected to be small relative to the existing uncertainties. H i has been shown to saturate at ∼ 10 \sim 10 M ⊙ pc 2 , ( Bigiel and Blitz, 2012 ) at the transition threshold between H i and H 2 . Assuming a radially flat H i distribution at this density, the median H i contribution is only ∼ 5 % \sim 5\% of the total dynamical mass within 2 R e 2R_{e} , and is therefore negligible compared to the uncertainties in the baryon fraction. However, we note that this contribution becomes more significant in lower-mass systems: for galaxies with M Dyn < 10 10 , M ⊙ M_{\mathrm{Dyn}}<10^{10},M_{\odot} , the median H i fraction rises to ∼ 27 % \sim 27\% .
- 2610.10117v1: MUSE-ALMA Haloes XVI: a census of the condensed baryons in z~0.5 HI absorption-selected galaxies
We estimate the H i masses following the prescription from Zu (2020) , based on the g − r g-r colour and stellar mass. For sources with impact parameters ≲ 100 \lesssim 100 kpc there is a correlation with the H i masses inferred from absorber properties, following Wang et al. (2026) , albeit with large scatter that is influenced by the local overdensity environment (Fig. 4 ). Both approaches provide valuable, independent means of estimating H i masses for intermediate-redshift galaxies.
- 2610.10117v1: MUSE-ALMA Haloes XVI: a census of the condensed baryons in z~0.5 HI absorption-selected galaxies
Figure 8 : Summary of the available properties for each galaxy in the MUSE–ALMA Haloes sample. Each vertical line represents a different galaxy, grouped by absorber and alternating between grey and white shading. Absorber systems are indicated along the bottom in the format Quasar _ \_ absorber–redshift, and the corresponding galaxy ID numbers are listed across the top. From top to bottom, the galaxy properties shown are stellar mass, molecular hydrogen mass, H i mass estimated from optical properties, H i mass estimated from absorber properties (for sources with b < 100 b<100 kpc and N H I < 10 20.5 N_{HI}<10^{20.5} cm -2 ) , dynamical mass, Sérsic model, kinematic model, star formation rate, 12 + log ( O / H ) 12+\log(\rm O/H) metallicity. The numbers listed on the right-hand side indicate the total number of galaxies for which each property is available. Points are coloured by the normalised value of each quantity. Upper limits for the M H2 M_{\rm H2} and SFR are shown with inverted triangle markers. Probable stellar masses and dust-corrected SFRs are indicated by square markers. Metallicities with unresolved upper–lower branch degeneracies are shown by triangle markers.
- 2610.10117v1: MUSE-ALMA Haloes XVI: a census of the condensed baryons in z~0.5 HI absorption-selected galaxies
To minimise environmental effects, Dénes et al. (2014) restrict their analysis to galaxies in low-density environments (defined by a projected 7th nearest-neighbour surface density of Σ 7 < 1 \Sigma_{7}<1 Mpc -2 ). They also test the impact of using a volume-limited sample and find that the resulting fits are in good agreement with those from their non-volume-limited sample. However, they do not adopt a volume-limited sample because the number of galaxies becomes too small. Furthermore, Chowdhury et al. (2024) compare results of H i stacking at z = 1 z=1 to this relation. They find that their results are consistent within 2 σ 2\sigma significance (see Fig. 3 in their paper).
- 2610.10117v1: MUSE-ALMA Haloes XVI: a census of the condensed baryons in z~0.5 HI absorption-selected galaxies
Galaxies were identified through either their continuum emission or emission lines. ProFound ( Robotham et al., 2018 ) was used to identify continuum sources in the MUSE data. The varying exposure depths between fields result in different limiting magnitudes ( Weng et al., 2023a , m r = 23.2 − 26.5 m_{r}=23.2-26.5 ; see Table 1 of ) , giving rise to non-uniform completeness for low-luminosity galaxies. Faint objects only detectable by their emission lines were systematically searched for without their continuum emission using the MUSE Line Emission Tracker (MUSELET) module of the MUSE Python Data Analysis Framework (MPDAF) package ( Bacon et al., 2016 ) . MPDAF was used to fit [O II ] λ \lambda λ \lambda 3726, 3729, H δ \delta λ \lambda 4102, H γ \gamma λ \lambda 4340, H β \beta λ \lambda 4861, [O III ] λ \lambda λ \lambda 4959, 5007, [N II ] λ \lambda λ \lambda 6549, 6583, H α \alpha λ \lambda 6563, and [S II ] λ \lambda λ \lambda 6717, 6730 lines. The emission line flux limits range from 2.3 × 10 − 18 2.3\times 10^{-18} ergs -1 cm -2 to 5.5 × 10 − 17 5.5\times 10^{-17} ergs -1 cm -2 and can be found in Table 2 in Péroux et al. (2022) . In addition, the deeper detection limits of the HST broadband imaging were used to identify source positions for spectral extraction from the MUSE data (see Table 4 of Péroux et al., 2022 , for the magnitude limits and corresponding central wavelengths) . This approach enabled the identification of ten additional [O II ] or Ly α \alpha emitters that were not detected by MUSELET. Finally, quasar PSF subtraction was applied to the MUSE observations, enabling the identification of galaxies at small projected separations from the quasar sightline.
- 2610.10117v1: MUSE-ALMA Haloes XVI: a census of the condensed baryons in z~0.5 HI absorption-selected galaxies
Figure 1 : Estimated H i mass as a function of stellar mass. The MUSE-ALMA Haloes galaxies are shown as circles, coloured from yellow to purple by their redshift. The diamond markers show the H i stacking results from Sinigaglia et al. (2024) at z ∼ 0.4 z\sim 0.4 and Chowdhury et al. (2022) at z ∼ 1 z\sim 1 . The grey shaded region and solid line shows the interquartile range and rolling median of the ( z ∼ 0 z\sim 0 ) xGASS sample for comparison. The ‘ × \times ’ markers and arrows show the absorber-selected z < 0.14 z<0.14 sample from Kulkarni et al. (2022) with 21cm H i measurements.
- 2610.10117v1: MUSE-ALMA Haloes XVI: a census of the condensed baryons in z~0.5 HI absorption-selected galaxies
We combine the results from the kinematic and Sérsic modelling presented in Weng et al. (2023b) and Karki et al. (2023) to estimate the total dynamical masses of the MUSE–ALMA Haloes galaxies. The total dynamical mass ( M D y n M_{Dyn} ) enclosed within radius R R is given by M D y n ( < R ) = R v circ 2 / G , M_{Dyn}(<R)=Rv_{\rm circ}^{2}/G, where v circ v_{\rm circ} is the circular velocity and G G is the gravitational constant. The circular velocity can be derived from the rotation velocity with an asymmetric drift correction to account for pressure support ( Burkert et al., 2010 ) . For an exponential disk, v circ 2 = v rot 2 + 2 ( R / R s ) σ 2 v_{\rm circ}^{2}=v_{\rm rot}^{2}+2(R/R_{s})\sigma^{2} , assuming R s = R e / 1.678 R_{s}=R_{e}/1.678 , where R e R_{e} is the effective radius from Sérsic fits to HST imaging by Karki et al. (2023) . We adopt the maximum rotational velocity and velocity dispersion derived from the kinematic models of the ionised gas emission lines from MUSE ( Weng et al., 2023b ) as the rotation velocity ( v rot v_{\rm rot} ) and velocity dispersion ( σ \sigma ) respectively. For reliable kinematic modelling, Weng et al. (2023b) adopted a signal-to-noise ratio cut of S/N > 3 >3 and required galaxies to satisfy R e / R PSF > 1.5 R_{e}/R_{\rm PSF}>1.5 . As the ionised gas emission traces the inner regions (in contrast to the extended H i discs in most nearby star-forming galaxies), we compute the dynamical mass within a comparable extent, adopting R = 2 R e R=2R_{e} .
- 2504.01079v1: HI 21-cm Absorption Associated with Foreground Galaxies on Top of Quasars
We detect H i 21-cm absorption toward the background radio-loud quasars associated with all three GOTOQs for which we could secure reliable spectra with uGMRT. Figure 2 provides the H i 21-cm absorption spectra for these GOTOQs: J0758+1136 (left panel), J1159+5820 (middle panel), and J1451+0857 (right panel). The continuum-normalized observed spectra are plotted in black, while the overall multiple component Gaussian fits to the absorption profiles are shown in red. The individual Gaussian components are shown using blue dashed lines. The full width at half maximum (FWHM) of individual Gaussian components ranges from 7 km s -1 to 11.1 km s -1 , with a median value of 9.3 km s -1 . The width of absorption lines can serve as a constraint on the temperature of the absorbing gas, assuming that thermal motions are the primary driver of line broadening. However, this estimate represents an upper limit, as additional factors such as turbulence can also contribute to the observed broadening. Assuming a representative Δ v FWHM = 10 \Delta v_{\text{FWHM}}=10 km s -1 for GOTOQs, we derive an upper limit on the kinetic temperature of the gas as T k ⩽ 2185 T_{k}\leqslant 2185 K [ 5 ] . This is higher than the T S T_{S} constraint we have obtained using the correlation between E ( B − V ) E(B-V) and ∫ τ 𝑑 v \int\tau dv (see section 4.3). This implies either the presence of non-thermal motions and/or hidden narrow components, which can be resolved by obtaining spectra at higher resolution and signal-to-noise ratio.
- 2504.01079v1: HI 21-cm Absorption Associated with Foreground Galaxies on Top of Quasars
Nine of the ten GOTOQs show detection of H i 21-cm absorption. The weakest H i 21-cm absorption was observed towards J1042+0748 with a measured ∫ τ 𝑑 v \int\tau dv of 0.19 kms − 1 \rm kms^{-1} [ 5 ] . If we consider the limiting ∫ τ 𝑑 v \int\tau dv of 0.3 kms − 1 \rm kms^{-1} as typically considered in the literature [ 20 , e.g.,] , then the H i 21-cm detection rate is ∼ \sim 80% for GOTOQs. This is by far the largest detection rate for H i 21-cm absorption in any population of isolated, intervening galaxies. Such large detection rates (i.e., ∼ \sim 80%) are also seen towards galaxy mergers at similar redshifts [ 16 , 17 ] . The optical depth measured in the case of detections are consistent with them being DLAs (assuming f c = 1 f_{c}=1 and T S = 100 T_{S}=100 K), except for J1042+0748, where VLBI observations constrain the H i column density to N H I ⩽ 1.5 × 10 20 cm − 2 \rm N_{H\,I}\leqslant 1.5\times 10^{20}\,cm^{-2} [ 5 ] .
- 2607.21719v1: Outflows in super-Eddington quasars drive clumpy circumgalactic medium and extended H$α$ nebulae at $z \gtrsim 6$
The results obtained in this work highlight that the central engine remains undetected and goes through obscured growth for most of its lifetime (see Fig. 3 ). We further show that H α \rm H\alpha nebular emission directly probes the obscuration stage of the accreting SMBH, with profiles remaining centrally concentrated and dropping off steeply when heavily obscured, even after a sustained bright quasar phase lasting around 1 Myr 1~{\rm Myr} . While the nebular emission shown in the left panel of Fig. 13 could be observationally attributed to short-lived quasar lifetimes, we rather find that it is associated with a period of intense accretion and radiation output that is heavily obscured. Such constant ‘lightbulb’ scenarios, however, are unlikely to be realistic because quasar light curves show significant variability. Nonetheless, Satyavolu et al. (2023) show that quasars with small duty cycle ( < 10 per cent <10~{\rm per~cent} ) and short active periods ( t quasar ∼ 10 4 yr t_{\rm quasar}\sim 10^{4}~{\rm yr} ) can reconcile measurements of both small and large proximity zones assuming that much of the black hole’s growth is obscured. Future radiative transfer simulations using realistic light curves from the simulations will enable us to study the effect of quasar variability (whose luminosity may vary rapidly by 1–2 dex) on lifetime estimates and provide further theoretical support for obscured growth and short but bright radiative phases in high-redshift quasars.
- 2607.21719v1: Outflows in super-Eddington quasars drive clumpy circumgalactic medium and extended H$α$ nebulae at $z \gtrsim 6$
Figure 8: Visual overview of the ionization state of the CGM in the suite of simulations at z = 6.01 z=6.01 . Here, gas is assumed to be in ionization equilibrium with a meta-galactic UVB. From left to right, the different columns show results for the NoAGN, fable and fable -sE simulations, respectively. The upper row displays the density-weighted neutral hydrogen fraction ( x H i x_{\text{H\,{i}}{}} ), while the lower row shows 2D bivariate projections of the neutral hydrogen column density ( N H i N_{\text{H\,{i}}{}} ) and density-weighted radial velocity ( v rad v_{\rm rad} ). This visualisation enables the simultaneous tracing of outflows and dense, neutral gas. The bivariate colourmap is shown as an inset in the bottom left panel, with the brightness/saturation reflecting the column density and the hue displaying the radial velocity. White contours delineate DLA sightlines ( N H i > 10 20.3 cm − 2 N_{\text{H\,{i}}{}}>10^{20.3}~{\rm cm^{-2}} ). In the lower panels, the full and dashed circles display the virial radius and R = 50 R=50 kpc, respectively. A large fraction of the CGM in the hot, diffuse phase is ionized by the UVB. Along the cosmic filaments and in the central galaxy, we have x H i > 0.1 x_{\text{H\,{i}}}{}>0.1 such that the column density is very high. We note that many more lines of sight are covered by dense and neutral gas in the fable -sE simulation, up to and beyond the virial radius. This excess of gas compared to the two other runs is almost entirely made up of outflowing gas clumps that arise from strong AGN feedback in fable -sE.
- 2504.20299v1: The Cosmic Evolution of CIV Absorbers at $1.4<z<4.5$: Insights from $100,000$ Systems in DESI Quasars
As described in Section IV.4 , we also measured completeness as a function of quasar rest-frame wavelength. The results are shown in Figure 11 . We observe that completeness varies between ∼ 70 − 80 % \sim 70-80\% within the absorber search window, with slightly lower values at the edges, because we slightly offset from the edges in our absorber search window . This behavior indicates that our continuum estimation is generally reliable and does not significantly impact the completeness analysis. Ideally, completeness would be flat if the continuum models were near-perfect.
- 2504.20299v1: The Cosmic Evolution of CIV Absorbers at $1.4<z<4.5$: Insights from $100,000$ Systems in DESI Quasars
The key results that we present in this paper include the differential C IV equivalent width frequency distribution, comoving path density, and cosmic mass density of C IV absorbers in the Universe within the redshift range 1.4 < z < 4.8 1.4<z<4.8 for absorbers with EW CIV ≥ 0.4 \mathrm{EW}_{\mathrm{CIV}}\geq 0.4 Å, using the latest DESI quasar data. We chose this threshold because we are ≳ 50 % \gtrsim 50\% complete above ∼ 0.4 Å \sim 0.4\,\rm\AA . Moreover, we use quasars with z qso ≥ 1.7 z_{\rm qso}\geq 1.7 ( ∼ 96 % \sim 96\% of the sample) for the Δ X \Delta X calculation, as used in Cooksey et al. [26] . Consequently, we also remove absorbers ( ≲ 1.5 % \lesssim 1.5\% ) associated with quasars at z qso < 1.7 z_{\rm qso}<1.7 for consistency. Finally, we compare our results with existing literature. This work is the largest statistical analysis of C IV absorbers to date based on one of the most extensive spectroscopic datasets in astronomy.
- 2510.19904v1: The Synthetic Absorption Line Spectral Almanac (SALSA)
The inclusion of the UVB also makes our results dependent on the particular UVB chosen ( Faucher-Giguère et al., 2009 ) , and different UVBs can lead to non-negligible differences for metal ionization states ( Taira et al., 2025 ) .
- 2510.19904v1: The Synthetic Absorption Line Spectral Almanac (SALSA)
Most modern cosmological hydrodynamical simulations include models for stellar evolution and the resulting production of heavy elements. Some subset of metal abundances are then tracked, in stars and in the gas-phase they return to. In the TNG model, for example, C, N, O, Ne, Mg, Si, and Fe are followed individually, in addition to total metallicity. This information reflects the complex interplay of metal production from different channels, i.e. from supernova Ia, II, and stellar winds, as well as subsequent advection and mixing in the gas-phase. It enables science applications beyond the assumption of solar abundance patterns ( Kumar et al., 2024 , e.g.) .
- 2510.13977v1: The THESAN-ZOOM project: The Hidden Neighbours of OI Absorbers during Reionization
Metal absorbers represent a powerful probe of galaxy feedback and reionization, as highlighted by both observational and theoretical results showing an increased abundance of low-ionised metal species at higher redshifts. The origin of such absorbers is currently largely unknown because of the low number of galaxy counterparts detected, suggesting that they might be surrounded by low-mass faint sources that fall below the detection threshold of current instruments. We use the thesan-zoom radiation hydrodynamic simulations to investigate the connection between properties of neutral oxygen ( O i ) absorbers and galaxies within the redshift range z = 5 − 8 z=5-8 . We find that the circumgalactic medium of galaxies becomes progressively ionised with cosmic time, leading to a decrease of ≈ 0.2 \approx 0.2 in the covering fraction of neutral oxygen, while the total oxygen covering fraction remains constant. The observable absorbers ( N O i ≳ 10 13 cm − 2 N_{\text{O\,{i}}}\gtrsim 10^{13}\,\text{cm}^{-2} ) are not confined to haloes: at z ≥ 5 z\geq 5 the majority ( ≳ 60 % \gtrsim 60\% ) arise beyond R vir R_{\mathrm{vir}} , and including these systems is essential to reproduce the observed increase in absorber incidence with redshift. The simulated absorbers preferentially reside in overdensities rich in low-mass galaxies ( M ⋆ ≤ 10 8 M ⊙ M_{\star}\leq 10^{8}\,\rm{M}_{\odot} ), explaining the scarcity of detected counterparts, while not excluding the possibility of nearby star-forming sources ( ≥ 5 M ⊙ yr − 1 \geq 5\,\text{M}_{\odot}\,\text{yr}^{-1} ) similar to those suggested by the latest ALMA observations and, at larger distances, by the JWST . These results establish O i absorbers as sensitive tracers of the evolving ionisation structure around faint galaxies to be probed by forthcoming deep spectroscopic surveys.
- 2510.13977v1: The THESAN-ZOOM project: The Hidden Neighbours of OI Absorbers during Reionization
Following a galaxy-centric method, the recent observational results of Higginson et al. (2025) also show the high incidence of neutral oxygen absorbers outside the virial radius of high-redshift galaxies. In their work, the O i covering fraction around [ O iii ]-emitting galaxies is used to evaluate the line density of neutral oxygen absorbers at z = 6 z=6 , with an approach similar to the one used in our work. Their result, shown as a light gray diamond in Fig. 11 , is lower than what blind quasar surveys suggest, implying that most of the neutral oxygen ( ≈ 65 % \approx 65\% ) should reside at larger distances from massive detectable galaxies ( M ⋆ ≳ 10 7.5 M ⊙ M_{\star}\gtrsim 10^{7.5}\,\rm{M}_{\odot} ) at z = 6 z=6 , close to low-mass sources or in dense neutral IGM pockets that survived reionization. Based on both our results and these recent observations, we investigate in the next section the role of neutral oxygen outside the CGM of haloes considered in our study.
- 2609.17680v1: A dense, metal-rich absorber driven by a heavily dust-obscured galaxy: The direct evidence of CGM enrichment at $z\sim7$
The C II/C IV column density ratio at z = 7.03 z=7.03 falls within 0.3 dex of the empirical redshift-dependent trend established by the XQR-30 legacy survey of z ≳ 5 z\gtrsim 5 quasar absorbers [ 42 ] , consistent with the global trend toward increasingly neutral, low-ionization CGM environments in the Epoch of Reionization (see Section IV.2 ). This concordance arises because the extraordinary metal column densities are enhanced uniformly across all ionization phases, preserving the standard relative ionic balance despite the absolute enrichment. At the current single-object precision the observation does not require any significant departure from the low- z z ionization balance.
- 2609.17680v1: A dense, metal-rich absorber driven by a heavily dust-obscured galaxy: The direct evidence of CGM enrichment at $z\sim7$
The unique physical regime revealed by this system, an extreme absorber intercepted at only 16 kpc from a heavily dust-obscured, vigorously star-forming host, points to two natural next steps. First, higher-spectral-resolution (e.g., R ∼ 10000 R\sim 10000 ) follow-up will be essential to constrain individual cloud b b -parameters. Only with the, break the saturation degeneracy in the column-density estimates, and more robustly characterize the underlying nucleosynthetic pattern. Second, if the enhanced [C/O] observed here is indeed a Pop III imprint, quasar-absorption spectroscopy toward confirmed high- z z galaxy–absorber pairs may prove a complementary route to probing Pop III enrichment, sidestepping the challenge of directly detecting individual Pop III stellar systems. Realizing both goals requires a systematic effort to identify high- z z absorber hosts even when they are NIR-dark, motivating targeted millimeter and sub-millimeter follow-up of high- z z metal-absorber fields with ALMA and NOEMA.
- 2508.10986v1: Population III star formation near high-redshift active galactic nuclei
Here we present the results of the three simulations of the AGN at 1000, 100, and 10 kpc, which we refer to as Scenarios A, B, and C, respectively. Figure 1 shows the build-up of dark matter mass in the simulated halo as a function of redshift. Runaway gravitational collapse of the primordial gas occurred at z z = 24.99, 15.46, and 12.63, for Scenarios A, B, and C, respectively. Our DM halo grew to a mass of 2.23 × 10 9 2.23\times 10^{9} M ⊙ at the time of runaway gravitational collapse in Scenario C. In Scenarios B and C, Compton scattering from the quasar background was powerful enough to keep the free electrons and photons in thermal equilibrium, meaning that the gas stayed ionized, preventing it from cooling via atomic electron transitions, and keeping it at a temperature of 78,000 K 78,\!000\ \text{K} , corresponding to the median photon energy of 26.95 eV of our adopted spectrum. The virial temperature ( Barkana & Loeb, 2001 ) , also plotted in Figure 1 , grew with the DM halo mass roughly until it reached the temperature of the gas for each respective scenario, at which point a runaway gravitational collapse occurred.
- 2508.10986v1: Population III star formation near high-redshift active galactic nuclei
We have presented three-dimensional radiation-hydrodynamics simulations of three scenarios, corresponding to DM haloes exposed to the radiation from an SMBH with a bolometric luminosity of 1.26 × 10 47 1.26\times 10^{47} erg s -1 . We ran simulations with background radiation fields of the SMBH at respective distances of 1000, 100, and 10 kpc from our DM halo (Scenarios A, B, and C, respectively), using an isotropic radiation background, calculated using an SED ( Haardt & Madau, 2012 ) that extends from 3 − 10 6 eV 3-10^{6}\ \rm eV . Our main findings are the following:
- 2509.09770v1: Early Stages of Dusty Tori: The First Infrared Spectra from a Highly Multiscale Quasar Simulation
We present the first infrared spectral predictions from a self-consistent simulation of the formation of a quasar in a starburst galaxy, spanning the cosmological environment to scales well below the dust sublimation region. The infrared (IR) emission is dominated by a torus-like dust structure composed of the highly magnetized, turbulence-supported outer accretion disk and of accreting gas tidally torn from the interstellar medium (ISM). At these early stages, the active galactic nuclei (AGN) is buried and Compton-thick. The near- to mid-IR escaping luminosity varies by almost an order of magnitude across sightlines, largely due to extinction from the inflowing stream of cold dust. Self-absorption within the torus suppresses silicate emission features, and further reprocessing by the ambient ISM leads to prominent silicate absorption and colder IR emission. The sublimation structure is stratified by composition and size, producing sightline-dependent extinction curves that intrinsically vary in shape. However, after repeated scattering in the optically thick dusty medium, these curves emerge substantially grayed. We also demonstrate that bipolar outflows from the central black hole that carve biconical cavities and reveal the central engine in later stages can preserve IR anisotropy and silicate features. These results suggest that dusty starburst quasars can undergo a buried, IR-bright phase early in their evolution.
Abstract
We use the MUSE-ALMA Haloes sample to build a census of the condensed baryons (stars and cold gas) to study the multiphase interstellar medium and circumgalactic medium (CGM). The sample includes 79 gas-rich galaxies at 0.2<z<1.2 located near strong HI Ly-alpha absorbers along quasar sightlines within projected separations of ~5-270 kpc and radial velocity separations of up to 500 km/s. HST spectroscopy characterises the absorbers, while HST imaging, MUSE and ALMA observations trace the stars, ionised gas and molecular gas. We find the following results. (i) HI masses inferred from optical properties show broad agreement with those derived from the CGM absorber properties for impact parameters <100 kpc, although group environments can significantly influence these estimates. (ii) The molecular gas fraction declines more steeply with stellar mass than the HI fraction. This suggests that stars build up more rapidly than the cold gas reservoir, while massive galaxies either consume their molecular gas more efficiently or convert HI into H2 less efficiently. (iii) Galaxies with high stellar surface densities exhibit the highest baryon fractions. This may reflect baryonic feedback, which can produce flatter inner dark matter profiles in high surface density systems, or aperture effects, where the ionised gas kinematic tracer probes only the innermost, baryon-dominated regions in compact sources, but extends further into the dark matter halo in sources with extended baryonic distributions. (iv) A few galaxies are consistent with being the baryon-dominated descendants of the low mass z~6 galaxies detected by JWST, while many appear to be substantially more dark matter dominated, lower mass systems with progenitors beyond JWST detection limits. This study provides a multiscale, multiphase view of the gas in and around galaxies, allowing us to probe the baryon budget across cosmic time.
Discussion
Discussion access requires a security token. Register for the weekly digest.