2611.00202v1 · First listed 2026-11-03
A Supermagnified Little Red Dot with a Resolved Host
Strong lensing resolves the z=8.297 Little Red Dot “Best Friend” into a <6.8 pc central component and a low-mass host. Its V-shaped central spectrum favors, but does not establish, black-hole activity over an ultradense stellar cluster. [1][4][7]
Evidence
Best Friend was observed behind MACS J1423 with eight-filter JWST/NIRCam imaging (6.4 ks per filter) and one 2.9 ks NIRSpec PRISM/CLEAR exposure (R≈100). Lens reconstruction and iterative forward modelling separate an elliptical host plus three point-like clumps. The authors measure μ=36^{+8}_{-12}, z_spec=8.297±0.002, host half-light radius 120±40 pc, and an unresolved brightest clump C1 with r_e<6.8 pc (2σ). Spatially resolved photometry and spectroscopy, fitted with Bagpipes stellar templates, give log(M*/M⊙)=7.3^{+0.2}_{-0.8} for the host; this interval incorporates magnification and star-formation-history (SFH) systematics. [2][3][4][7][9]
Earlier work
Earlier population work finds LRD UV slopes redder than those of normal star-forming galaxies at matched redshift and UV luminosity, with median Δβ_UV=0.60. That establishes a population-level color distinction, whereas this paper uses lensing to isolate one LRD-like central component from its host. The authors also compare a purely stellar C1 interpretation with typical high-z clusters: it would require Σ*≥1.25^{+0.4}_{-0.3}×10^6 M⊙ pc^-2, about two orders of magnitude higher. [13][7]
What changes
The key advance is source-plane, component-resolved analysis of a highly magnified LRD host at ≲7 pc scales. C1 has the defining V-shaped spectrum but lies 50±10 pc from the reconstructed galaxy center; the authors caution that differential magnification could produce the apparent offset. They argue that the density required for a stellar-cluster origin makes black-hole activity the better interpretation, while retaining the cluster scenario as possible. [1][4][7]
Limits and open questions
No broad lines are detected, and the authors attribute the inability to confirm them to limited PRISM signal-to-noise and resolution; hence neither a black hole nor a virial black-hole mass is secured. Host mass is SFH-sensitive: tested prescriptions span log(M*/M⊙)=6.34–7.30 because young stars can outshine an older population. The C1 positional offset may be lensing-driven, and the proposed BH-to-stellar-mass implication awaits deeper, higher-resolution spectroscopy. [1][8][9]
The main paper is supported by abstract and selected HTML extracts; supplied figure captions provide figure-specific content, but no full tables, line measurements, or lens-model methodology are available here.
Key figures
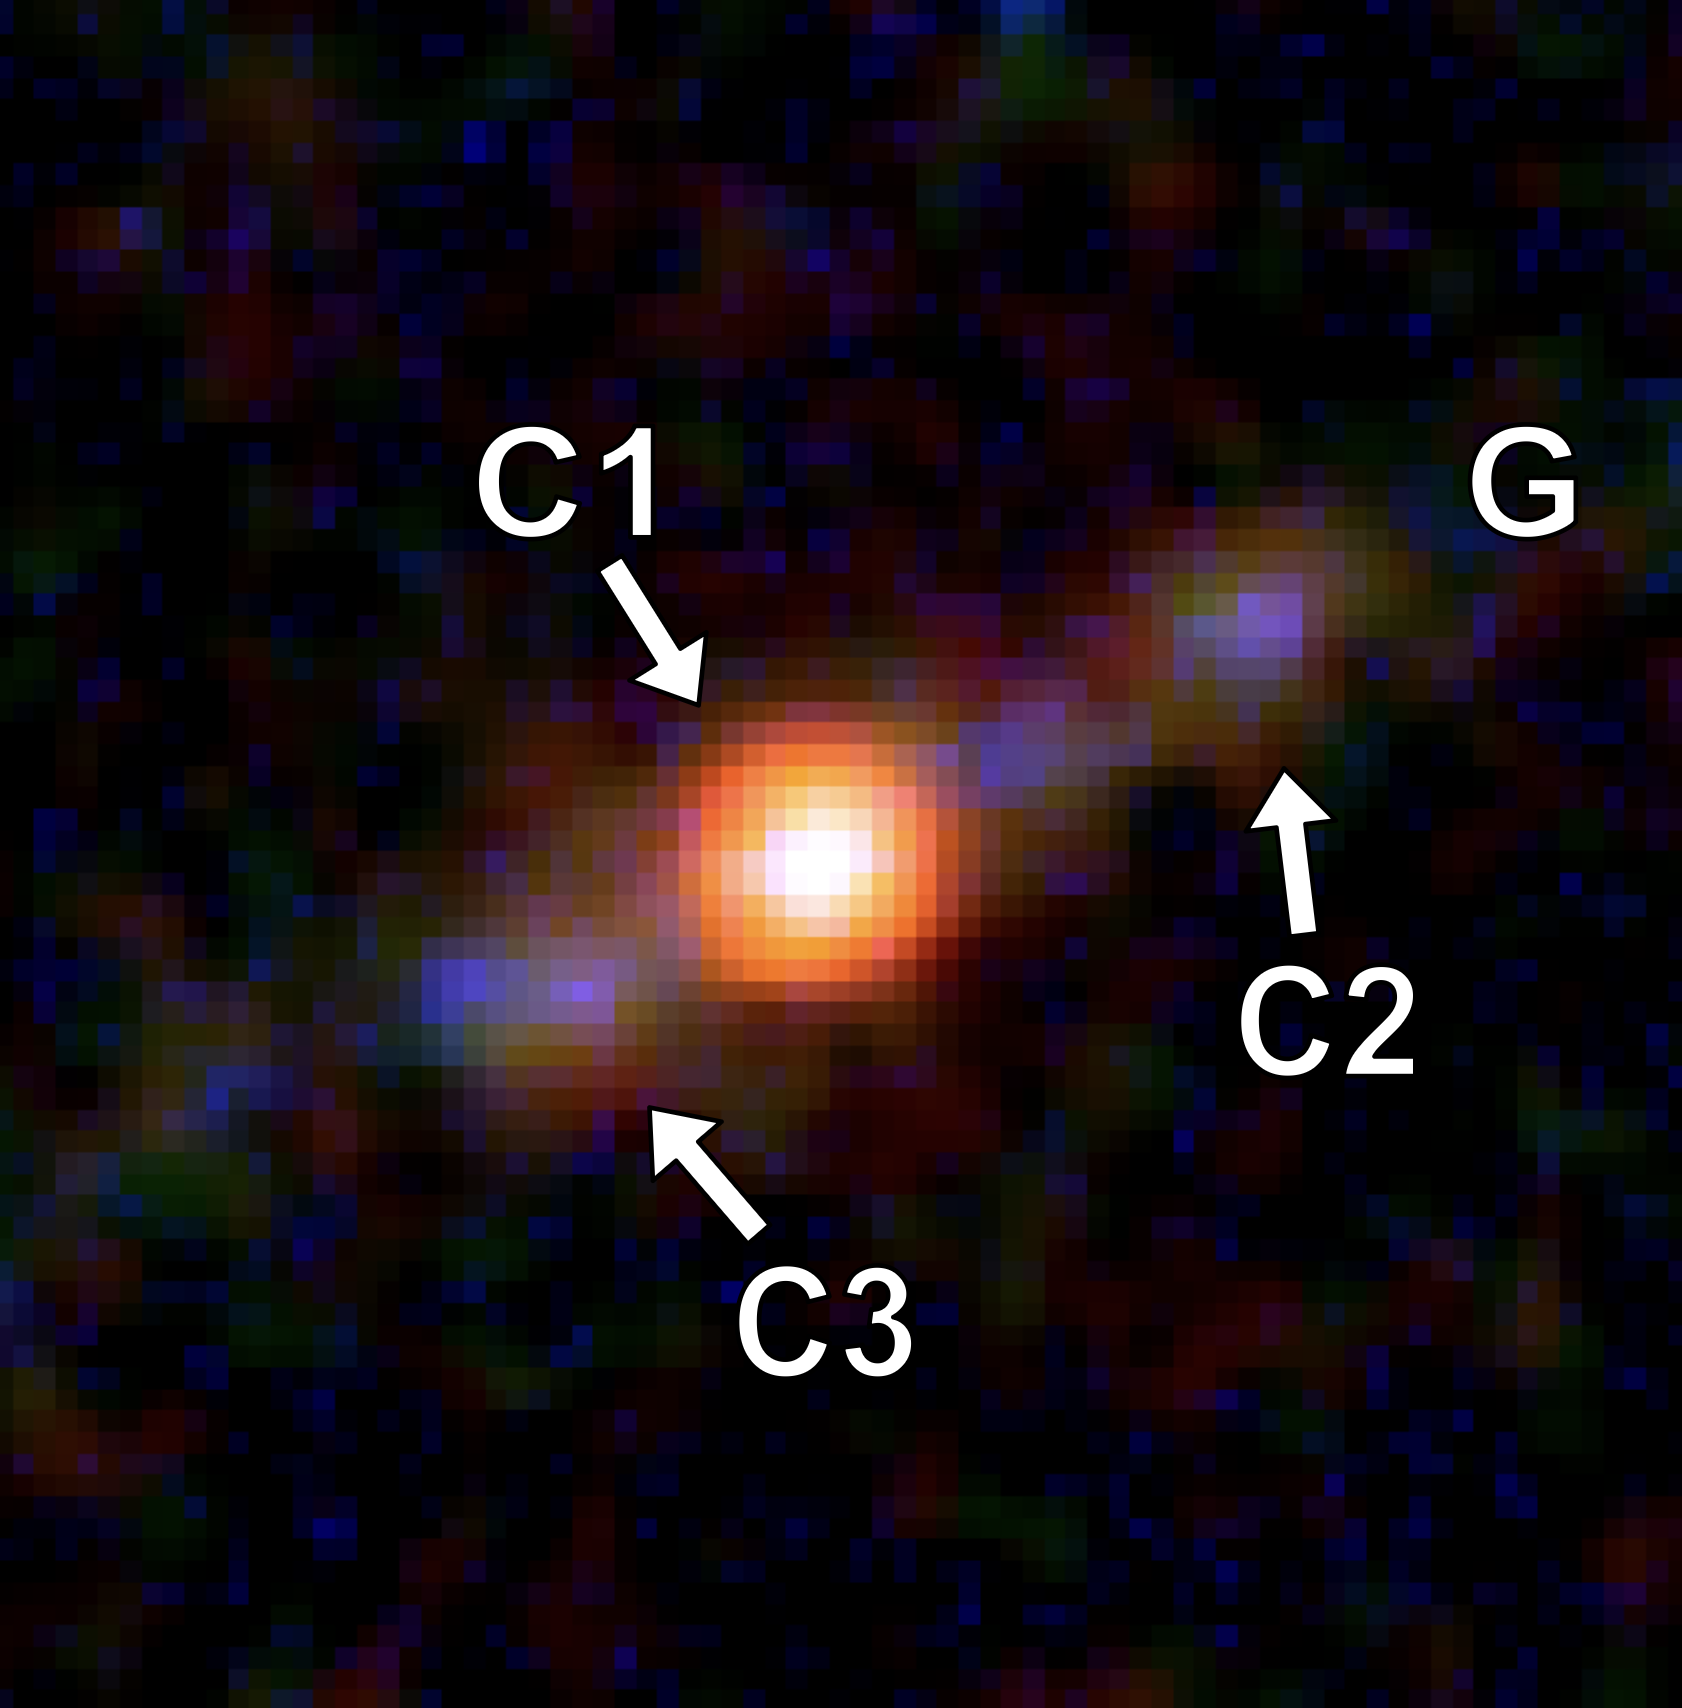
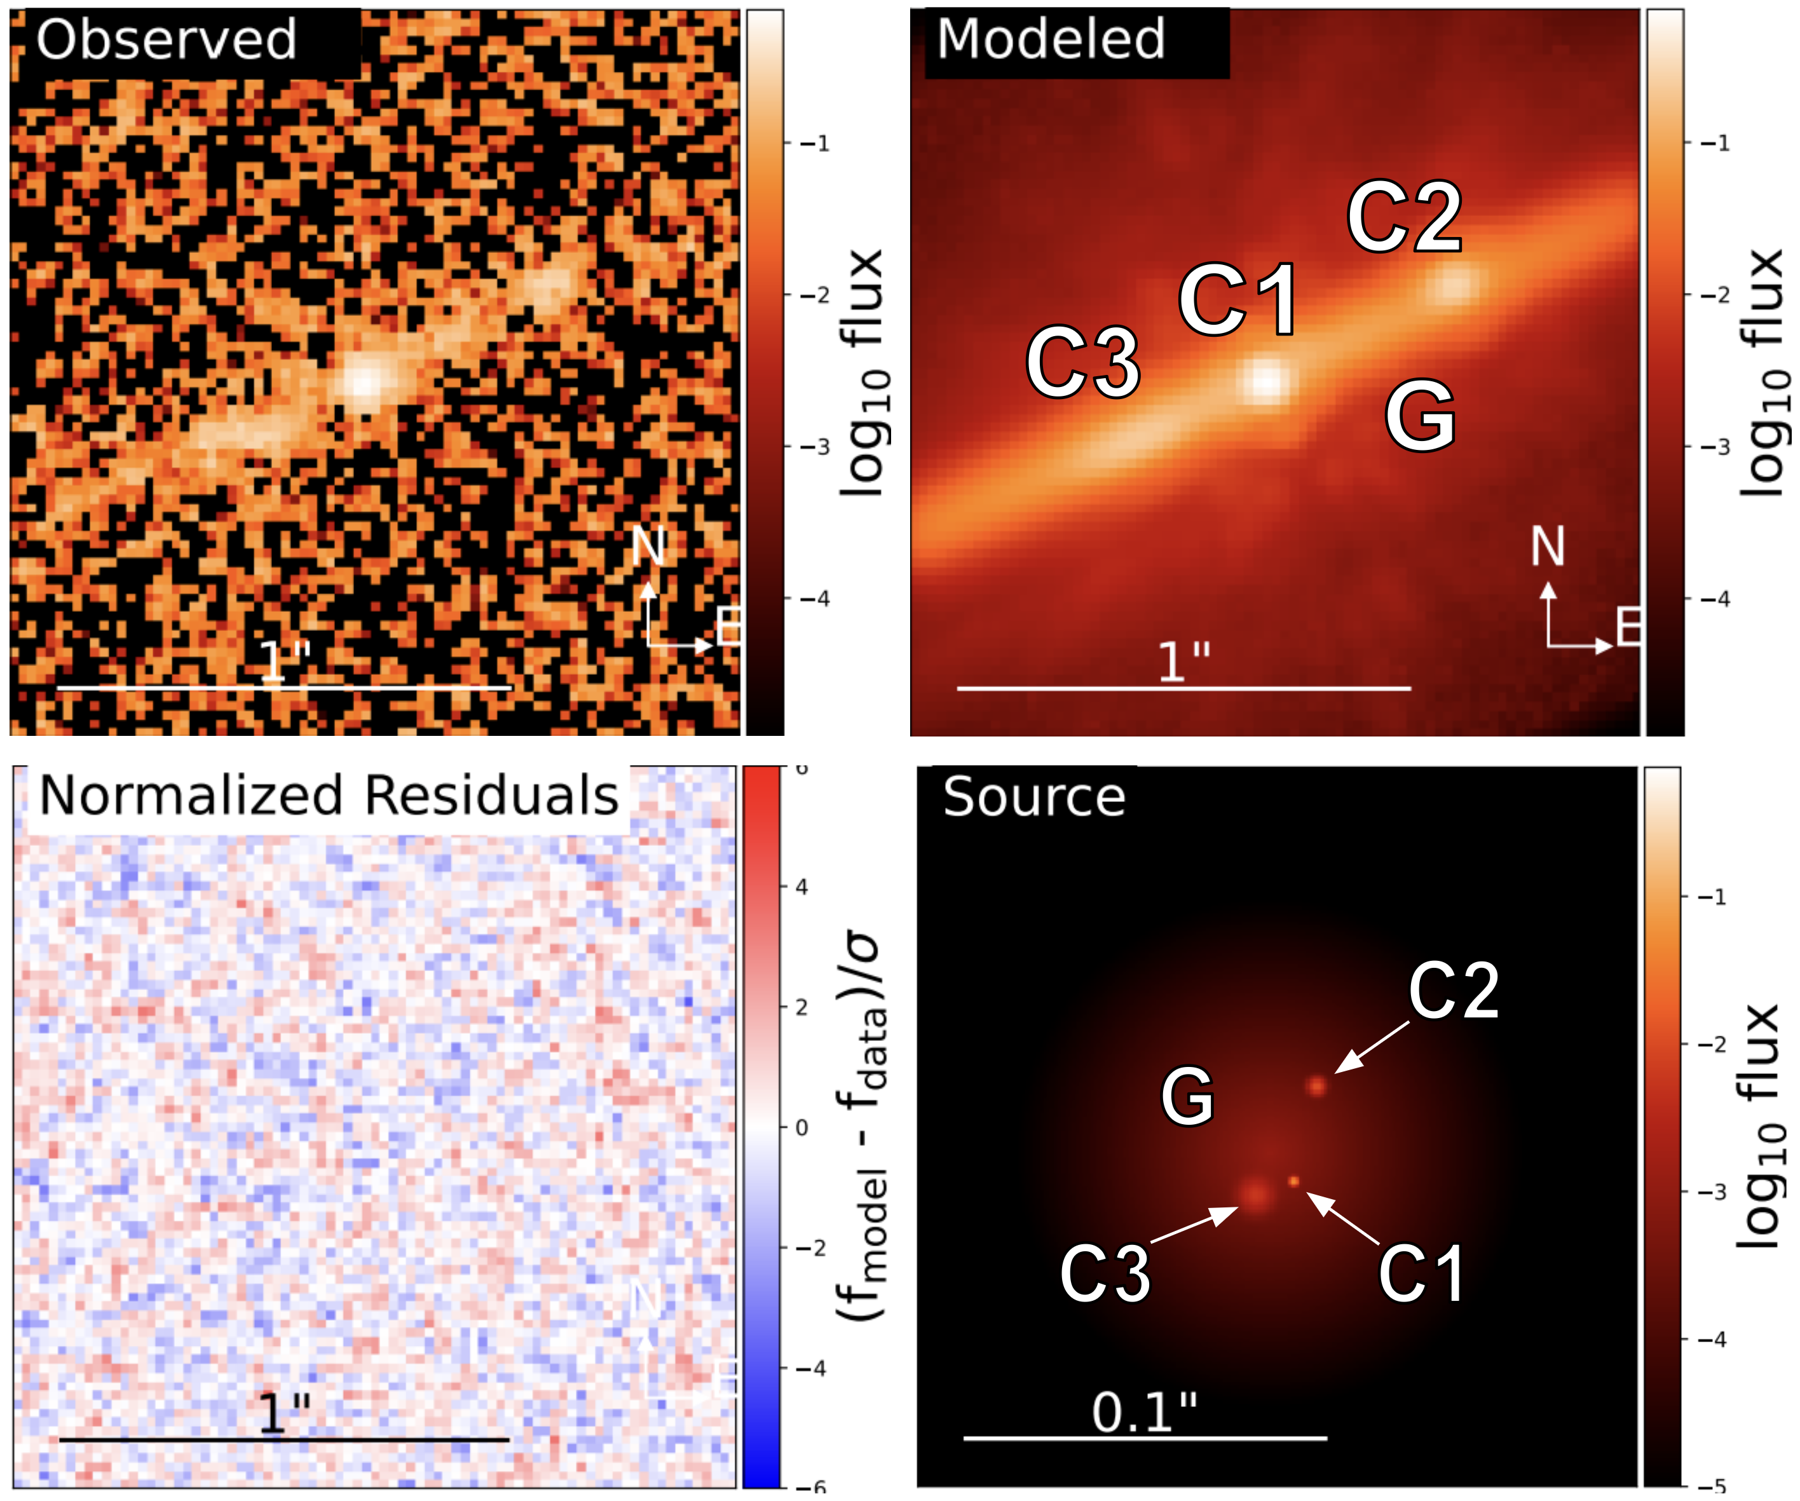
Tests whether lens modelling can deblend the lensed image into a host and three clumps. Residuals assess adequacy of the four-component forward model, while the source-plane reconstruction tests the reported ∼50 pc C1–host-center offset.
Original caption
Figure 1: Left: RGB of Best Friend. Seen is the underlying light of the galaxy (labeled G) and 3 clumps (labeled C1 to C3). Clump 1 is the brightest and has characteristics of an LRD. Top middle: F200W NIRCam image used for lensing reconstruction. Top right: Best modeled image. This is the result of forward modeling the four source components. Bottom middle: Normalized residuals. Bottom right: Best source-plane model after iterative forward modeling on the full set of lens model samples. Note that C1 is by far the brightest clump and is found to be located 50 − 10 + 10 pc 50^{+10}_{-10}\,\mathrm{pc} from the galaxy center.

Tests the central-engine interpretation by comparing extracted total, host-subtracted C1, and host spectra. It also shows the Balmer-line model associated with the quoted BH-mass upper limit; non-detection of broad lines remains inconclusive at the available PRISM quality.
Original caption
Figure 2: a) 2D spectrum with extraction bands. b) Spectrum of the C1 region without the host subtracted. In purple and gold are models for UV and rest optical respectively. Detected (nondetected) emission lines are marked with solid (dashed) lines. Added is also an RGB inset with blue (red) rectangles showing regions of host (C1) spectrum extraction. All spectra in this figure are observed (not corrected for magnification). c) Total spectrum of Best Friend. d) Spectrum of just the C1 with host galaxy subtracted. See text and Appendix B for details of normalization. Inset zooms in on the Balmer lines to show the model corresponding to the BH mass upper limit, M B H < 10 8.9 M ⊙ M_{BH}<10^{8.9}\mathrm{M_{\odot}} . e) Spectrum of only the host galaxy extracted from blue extraction regions in RGB inset and normalized. Galaxy model from Bagpipes with only stellar templates and Iyer et al. [29] SFH is plotted in green.

Places the object’s BH-mass upper limit and host-mass interval against JWST AGN/LRD samples and local and z∼4–7 relations. It tests possible BH-to-host-mass tension, but cannot determine that ratio without a measured BH mass.
Original caption
Figure 3: Black hole vs stellar mass relation of AGN objects spectroscopically observed by JWST above z > 3.5 z>3.5 ( Gupta et al. [24] , modified) with redshift indicated by colors. We additionally show the position of CANUCS LRDz-8.6 [ 63 ] and QSO1 LRD [ 32 ] . Best Friend is presented with a BH mass upper limit and the stellar mass interval that includes the systematic uncertainty of different SFH assumptions and lensing magnification uncertainty as a purple box. Shown are also the local universe relation by Greene et al. [23] and relation at z ∼ 4 − 7 z\sim 4-7 by Pacucci et al. [52] . Lines for different M B H / M ⋆ M_{BH}/M_{\star} are indicated.
Related research
Previous digest
Judež et al. present “Best Friend,” a gravitationally lensed little red dot at zspec = 8.297 with μ = 36^{+8}_{-12}, making it the most highly magnified LRD reported and resolving both its host and a central component smaller than 7 pc. Spatially separated NIRCam photometry and NIRSpec/PRISM spectroscopy isolate the bright LRD-like clump from its underlying galaxy, yielding a host stellar mass of log(M*/M☉) = 7.3^{+0.2}_{-0.8}. Although no broad lines are detected at the available signal-to-noise and resolution, the compact central spectrum is more naturally interpreted as black-hole activity than as a dense stellar cluster; the stellar alternative would require an exceptionally high surface density, above 1.25^{+0.4}_{-0.3} × 10^6 M☉ pc^-2. The system shows how extreme lensing can turn normally unresolved LRDs into spatially resolved tests of their central engines and host-galaxy masses.
Sources and evidence (25)
- 2611.00202v1: A Supermagnified Little Red Dot with a Resolved Host
Little red dots (LRDs) are an intriguing new class of sources in the early universe discovered by the James Webb Space Telescope (JWST) characterized by V-shaped spectra and extremely compact sizes. Their underlying mechanisms still remain the subject of ongoing debate. We present JWST observations of a gravitationally lensed LRD nicknamed "Best Friend" at $z_{\rm spec} = 8.297\pm0.002$. Its high magnification factor of $μ= 36^{+8}_{-12}$ makes it the highest magnified LRD reported to date and unveils both the resolved structure of its host and a central engine less than 7 pc in size. The spectrum of the central engine, in which broad lines are not detected, possibly owing to the limited S/N and spectral resolution, is better interpreted as black hole activity rather than a dense star cluster. The latter cannot be fully excluded, but if true, the resulting lower limit on stellar density would be $>1.25^{+0.4}_{-0.3}\cdot10^6 \mathrm{M_{\odot}/pc}^2$, which is around 2 orders of magnitude higher than stellar densities of typical clusters at high-z. By performing a spatially resolved analysis of NIRCam photometry and NIRSpec/PRISM spectroscopy, we find that the host stellar mass is $\log(M_\star/M_{\odot}) = 7.3^{+0.2}_{-0.8}$. Best Friend demonstrates the power of lensing to reveal the morphologies of LRDs.
- 2611.00202v1: A Supermagnified Little Red Dot with a Resolved Host
Cluster MACS J1423.8+2404 (MACS 1423, hereafter, at z s p e c = 0.5450 ± 0.0005 z_{spec}=0.5450\pm 0.0005 ) was observed in February 2023 with JWST Near Infrared Camera (NIRCam) filters F090W, F115W, F150W, F200W, F277W, F356W, F410M and F444W each with 6.4 ks exposure time. This resulted in the corresponding 3- σ \sigma depths of 29.51, 29.58, 29.73, 29.86, 30.12, 30.21, 29.50, 29.84 mag respectively, based on 0.3 ″aperture photometry. We subtracted bright cluster galaxies following the procedure described in Section 3 of Martis et al. [43] . We also produced custom empirical point spread functions (PSFs) as outlined in Sarrouh et al. [58] .
- 2611.00202v1: A Supermagnified Little Red Dot with a Resolved Host
CANUCS revisited the same cluster 3 months later for spectroscopic follow-up with the JWST Near Infrared Spectrograph (NIRSpec) Micro-Shutter Assembly (MSA) with a low-resolution PRISM/CLEAR disperser ( R ∼ 100 R\sim 100 ). Best Friend was observed in one 2.9 ks MSA configuration. It was nodded over a 3-shutter slitlet, resulting in the total of 5 MSA shutters of data. Details of the initial spectra processing are given in Desprez et al. [16] . Further details are also outlined in Sect. 3.3 of the CANUCS data release paper 57 .
- 2611.00202v1: A Supermagnified Little Red Dot with a Resolved Host
Results of morphological analysis with Lenstruction are summarized in Table 1 . Models of all 4 components were fitted for sizes (all reported as half-light radii) and positions. Clump 1 (C1) is unresolved, so we can measure the upper limit of its size which we find is only < 6.8 pc ( 2 σ ) <6.8\,\mathrm{pc}\ (2\sigma) . Clump 2 is tentatively resolved at 7 − 4 + 2 pc 7^{+2}_{-4}\,\mathrm{pc} and clump 3 is slightly larger at 14 − 5 + 5 pc 14^{+5}_{-5}\,\mathrm{pc} . The entire (host) galaxy has a size of 120 − 40 + 40 pc 120^{+40}_{-40}\,\mathrm{pc} . Interestingly, the C1 appears to be offset from the center by 50 ± 10 pc 50\pm 10\,\mathrm{pc} , though this might also be an effect of differential magnification.
- 2611.00202v1: A Supermagnified Little Red Dot with a Resolved Host
Table 2: Photometry and spectrophotometric fitting results
- 2611.00202v1: A Supermagnified Little Red Dot with a Resolved Host
a) Photometry of respective components, not corrected for magnification (see Appendix A ). b) Rest UV and optical slope values of spectra. c) Bagpipes runs results. Host and C1 are modeled with only stellar templates, Total BF also with an AGN model. Values for C1 are not values we think are likely to be true, since we believe the light we see is from an AGN/LRD. Shown are stellar mass, star formation rate (both corrected for magnification), dust attenuation and mass weighted age.
- 2611.00202v1: A Supermagnified Little Red Dot with a Resolved Host
We present the spectroscopic and photometric investigation of a Little Red Dot with a resolved host galaxy called “Best Friend”. It is the highest magnified LRD currently known ( μ b e s t = 36 − 12 + 8 \mu_{best}=36^{+8}_{-12} ). High magnification and the resulting large apparent size of the host allow us to spatially separate the host galaxy from the central region and investigate them separately all while reaching spatial scales down to ≲ 7 pc \lesssim 7\,\mathrm{pc} . The central region (C1) has a clear V-shaped spectrum and so meets the LRD criteria [ 34 ] , but because the available spectrum lacks resolution and sensitivity, we currently cannot confirm broad lines. Our work also shows that it is highly unlikely that this central region would be purely stellar in nature as this would imply extremely large stellar densities ( Σ ⋆ ≥ 1.25 − 0.3 + 0.4 ⋅ 10 6 M ⊙ / pc 2 \Sigma_{\star}\geq 1.25^{+0.4}_{-0.3}\cdot 10^{6}\ \mathrm{M_{\odot}/pc^{2}} ), two orders of magnitude higher than those observed in high-redshift stellar clusters [ 1 ] and higher than in the densest cores of local globular clusters [ 25 ] . We find that the host stellar mass is log ( M ⋆ / M ⊙ ) = 7.3 − 0.8 + 0.2 \log(M_{\star}/M_{\odot})=7.3^{+0.2}_{-0.8} with errorbars including lensing magnification uncertainty and estimates of systematic uncertainties from different SFH modeling prescriptions.
- 2611.00202v1: A Supermagnified Little Red Dot with a Resolved Host
Without lensing magnification, the Best Friend would be a point source and the strong contribution of the host galaxy would make the spectrum blue in UV and optical, classifying it as a Little Blue Dot (e.g., Madau and Maiolino 39 , Pérez-González et al. 55 ). Fig. 3 shows that, thanks to the strong magnification, Best Friend has one of the lowest stellar masses discovered so far at high-z and, within the LRD population, it has one of the most robustly measured stellar masses thanks to its resolved host. At such high redshift, a high ratio of BH mass vs. stellar mass of ≲ 40 \lesssim 40 could imply a heavy-seed BH formation mechanism and challenge current host-BH coevolution models, but the BH mass needs to be measured accurately by deep higher resolution observations.
- 2611.00202v1: A Supermagnified Little Red Dot with a Resolved Host
Our final best estimate of the host stellar mass is log ( M ⋆ / M ⊙ ) = 7.3 − 0.8 + 0.2 \log(M_{\star}/M_{\odot})=7.3^{+0.2}_{-0.8} , including lensing uncertainty. This result accounts for the masses obtained using several different SFH models which produced substantially different results, almost by an order of magnitude in stellar mass and with different population ages. These differences are mostly driven by the fact that there is a recent elevated star-formation activity present with a star-formation rate of ∼ 10 M ⊙ / yr \sim 10\,\mathrm{M_{\odot}/yr} which was detected across all models. This young population is outshining a possible older population and different SFH models treat outshining differently. Such differences were also demonstrated in Markov et al. [42] . If we used Iyer et al. [29] SFH model, the Bagpipes result with purely stellar templates was log ( M ⋆ / M ⊙ ) = 7.30 − 0.03 + 0.02 \log(M_{\star}/M_{\odot})=7.30^{+0.02}_{-0.03} and gives an old stellar population with mass weighted age of 470 − 60 + 10 Myr 470^{+10}_{-60}\,\mathrm{Myr} . Leja et al. [37] SFH model, gives a much lower stellar mass at log ( M ⋆ / M ⊙ ) = 6.45 − 0.06 + 0.08 \log(M_{\star}/M_{\odot})=6.45^{+0.08}_{-0.06} produced very recently with a mass weighted age of only 18 − 5 + 69 Myr 18^{+69}_{-5}\,\mathrm{Myr} . When using the double power law SFH model, it gives an even lower mass weighted age of just 1.26 − 0.02 + 0.06 Myr 1.26^{+0.06}_{-0.02}\,\mathrm{Myr} with the mass of log ( M ⋆ / M ⊙ ) = 6.34 − 0.02 + 0.03 \log(M_{\star}/M_{\odot})=6.34^{+0.03}_{-0.02} .
- 2611.00202v1: A Supermagnified Little Red Dot with a Resolved Host
We also performed spectrophotometric SED fitting of the full spectrum of Best Friend to see, how we would interpret it if it was not lensed and would be visible only as a point source. Results are summarized in the “Total” column of Table 2 . This modeling uses Bagpipes setup with an AGN model that was set to have a break in the double power law at the Balmer limit.
- 2604.14551v1: Discovery of low-redshift analogues to "Little Red Dots" in DESI: A later evolutionary stage of compact LRDs?
We have conducted a systematic search for low-redshift analogues to the high-redshift LRD population within the DESI DR1 spectroscopic survey. Our search identified five objects at 0.2 < z < 0.4 0.2<z<0.4 that share the defining characteristics of the LRD. Our findings are summarized below.
- 2604.14551v1: Discovery of low-redshift analogues to "Little Red Dots" in DESI: A later evolutionary stage of compact LRDs?
Unlike high-redshift LRDs, our low-redshift analogues are unambiguously classified as AGN by BPT/VO diagnostics. This suggests they reside in more chemically mature, relatively metal-rich host galaxies.
- 2606.03522v1: The UV Side of Little Red Dots: Red, Compact, and Iron-Enhanced Rest-UV Emission with a Strong Downturn around Ly$α$
Figure 3: Relative values of the UV slopes of the LRDs against those calculated from the M UV M_{\mathrm{UV}} - β UV \beta_{\mathrm{UV}} relation of normal SFGs, Δ β UV = β UV , LRD − β UV , base \Delta\beta_{\mathrm{UV}}=\beta_{\mathrm{UV,\,LRD}}-\beta_{\mathrm{UV,\,base}} , color-coded by redshift. The histograms of M UV M_{\mathrm{UV}} and Δ β UV \Delta\beta_{\mathrm{UV}} are shown in the top and right subplots, respectively. The black dotted and red dashed horizontal lines indicate zero and median Δ β UV \Delta\beta_{\mathrm{UV}} values, respectively. A positive (negative) Δ β UV \Delta\beta_{\mathrm{UV}} means that a given LRD has redder (bluer) UV slope compared to an average star-forming galaxy with a similar redshift and M UV M_{\mathrm{UV}} . The Δ β UV \Delta\beta_{\mathrm{UV}} distribution is clearly skewed towards the positive values with the median value of 0.60 0.60 , indicating that LRDs have redder UV slopes compared to normal star-forming galaxies at a population level.
- 2606.03522v1: The UV Side of Little Red Dots: Red, Compact, and Iron-Enhanced Rest-UV Emission with a Strong Downturn around Ly$α$
In the right panel of Figure 12 , we compare the EWs of Fe ii . We find that LRDs with redder UV slopes have larger EW ( Fe ii ) \mathrm{EW(Fe\,\text{{\sc ii}})} . These results may imply that BH activities are similar across different LRD subsamples, but the relative contributions of the host galaxy greatly differ. We discuss this point in the Section V.1 .
- 2508.14155v1: Little Red Dots and their Progenitors from Direct Collapse Black Holes
We implement BH feedback through thermal energy injection, resulting from BH accretion. The energy injected to the nearby cold gas at each timestep δ t \delta t is determined as
- 2508.14155v1: Little Red Dots and their Progenitors from Direct Collapse Black Holes
We compare our model outputs with various LRD observations, specifically considering two classes of BH populations: heavy DCBH seeds, and light stellar-remnant seeds that are accreting at Eddington/super-Eddington rates. For the heavy seed models, we consider 4 cases - the Eddington-limited case, super-Eddington limited growth (up to 1.5 times Eddington), forced super-Eddington growth (where all DCBHs accrete at super-Eddington rates when gas is available with f edd = 1.5 f_{\rm edd}=1.5 ), and the case imposing a higher LW flux threshold for DCBH formation (up to J crit = 3000 − 10000 J_{\rm crit}=3000-10000 ). The default heavy DCBH case used for our analysis is the Eddington-limited model, unless stated otherwise. For the light seeds, we consider 2 cases - super-Eddington limited (up to 1.5 times) and forced super-Eddington growth ( f edd = 1.5 f_{\rm edd}=1.5 ). The default model for light seeds is the super-Eddington limited case unless stated otherwise.
- 2509.03291v1: What Do Radio Emission Constraints Tell Us About Little Red Dots as Tidal Disruption Events?
The real nature of little red dots (LRDs), a class of very compact galaxies in the early Universe recently discovered by the James Webb Space Telescope, is still poorly understood. The most popular theories competing to interpret the phenomena include active galactic nuclei and enhanced star formation in dusty galaxies. To date, however, neither model gives a completely satisfactory explanation to the population as a whole; thus, alternative theories have arisen, including tidal disruption events (TDEs). By considering observational constraints on the radio emission of LRDs, we discuss whether TDEs are adequate alternatives solving these high-redshift enigmas. We utilise radio flux density upper limits from LRD stacking analyses, TDE peak radio luminosities, and volumetric density estimates. We find that the characteristic values of flux densities and luminosities allow radio-quiet TDEs as the underlying process of LRDs in any case, while the less common radio-loud TDEs are compatible with the model under special constraints only. Considering other factors, such as volumetric density estimates, delayed and long-term radio flares of TDEs, and cosmological time dilation, TDEs appear to be a plausible explanation for LRDs from the radio point of view.
- 2507.12618v1: Supermassive Stars Match the Spectral Signatures of JWST's Little Red Dots
Successful Matching of Observed Spectra: By applying physically motivated broadening mechanisms, including a powerful stellar wind ( v ∞ ≈ 1500 km s − 1 v_{\infty}\approx 1500\,\mathrm{km\,s^{-1}} ) and large-scale macroturbulence ( σ v ≈ 1250 − 1500 km s − 1 \sigma_{v}\approx 1250-1500\,\mathrm{km\,s^{-1}} ), our model quantitatively reproduces the broad line profiles observed in both LRD targets, matching the measured FWHM of MoM-BH*-1 to within 4%.
- 2507.12618v1: Supermassive Stars Match the Spectral Signatures of JWST's Little Red Dots
We have presented a first-principles investigation into whether Population III supermassive stars (SMSs) can serve as the central engines for the enigmatic class of objects known as Little Red Dots (LRDs). By developing a novel pipeline that combines a GENEC stellar evolution model with a detailed radiative transfer and spectral synthesis code, we have demonstrated that a single, non-rotating 10 6 M ⊙ 10^{6}M_{\odot} SMS can successfully reproduce the key observational features of two prominent LRDs: MoM-BH*-1 at z = 7.76 z=7.76 and The Cliff at z = 3.55 z=3.55 .
- 2512.03239v1: (Re)solving the complex multi-scale morphology and V-shaped SED of a newly discovered strongly-lensed Little Red Dot in Abell 383
Alternatively, the emission may be dominated by an evolved stellar population. The presence of a Balmer break in the SED suggests that the F277W morphology (with an effective radius of ∼ 150 \sim 150 pc) may trace the older stellar component. The best-fit stellar mass of ∼ 6 × 10 10 M ⊙ \sim 6\times 10^{10}~M_{\odot} within an effective radius would imply high stellar densities ( Σ eff ∼ 4 × 10 5 M ⊙ / pc 2 \Sigma_{\rm eff}\sim 4\times 10^{5}{\rm M_{\odot}}\rm/pc^{2} ) and therefore require substantial dynamical support. Using the scaling arguments of Baggen et al. [6] , such a system would be expected to exhibit velocity dispersions of order ∼ 700 \sim 700 km s -1 , corresponding to FWHM line widths of ∼ 1600 \sim 1600 km s -1 and resolvable across ∼ \sim 150 pc scale. However, if the stellar mass is enclosed within a smaller radius, as suggested by the more compact sizes in redder filters, the required velocity dispersions would be even higher.
- 2512.03239v1: (Re)solving the complex multi-scale morphology and V-shaped SED of a newly discovered strongly-lensed Little Red Dot in Abell 383
The resulting photometry (in nanojanskys) is presented in Table 1 and the SED is shown in Figure 2 . Our measurements are consistent with previous measurements by Richard et al. [52] . Its red colors, already identified in the Spitzer/IRAC 3.6 and 4.5 μ \mu m bands, had previously been interpreted as evidence of a strong Balmer break and thus a massive galaxy with an old stellar population [ 52 ] . Our new JWST/NIRCam photometry confirms that the discontinuity indeed falls at the Balmer break, producing the characteristic ”double-break” (or ”V-shape” when plotted in f λ f_{\lambda} ) SED. The observed colors (for both S1 and S2) are:
- 2601.22214v1: The Little Blue and Red Dots Rosetta Stones: Non-Gaussian broad lines, hot dust, and X-ray weakness
Together, the large decrement of the broad lines and the small decrement of the narrow lines have been interpreted as evidence for localized dust near the BLR in the AGN ( Nikopoulos et al., 2025 , e.g.,) , or the result of collisional excitation as the primary emission mechanism of the broad lines ( Ji et al., 2026b ; Torralba et al., 2025 ; Torralba et al., 2026 , e.g.,) . Case-B recombination ratios combined with known dust-attenuation curves have been ruled out in one case ( D’Eugenio et al., 2025c ; Nikopoulos et al., 2025 ) , based on the line ratios of broad H α \alpha , H β \beta , and H γ \gamma . However, observations with the necessary SNR are very few, hence it is unclear how this result generalizes to the wider population. It is clear, nevertheless, that the Blue Rosetta and quasars in general have Balmer decrements much closer to the Case-B values see Übler et al., 2023 for GS-3073, while Dong et al., 2008 find a H α \alpha /H β \beta ratio of 3.06 and 10% scatter for SDSS Seyfert 1 and quasars . However, the apparent agreement between the observed H α \alpha /H β \beta ratios of blue AGN and the Case-B value may be deceptive, since these ratios may occur even in optically thick regimes ( Ruff et al., 2012 ) , a scenario supported by several lines of evidence ( Glikman et al., 2006 ; Ruff et al., 2012 , including the low Pa α \alpha /Pa β \beta flux ratio;) . A key difference is that the H α \alpha /Pa β \beta ratios in LRDs span a broad range of 3–12 ( de Graaff et al., 2025a ) , while the BLR models of Ruff et al. (2012) remain confined to H α \alpha /Pa β ≳ 10 \beta\gtrsim 10 .
- 2601.22214v1: The Little Blue and Red Dots Rosetta Stones: Non-Gaussian broad lines, hot dust, and X-ray weakness
Table 1 : Line widths of hydrogen, helium and [O iii ] lines in GS-3073, based on the purely Gaussian emission line model described in Sect. 6 , for both single and total components. For comparison, the results of exponential parametrization (Sect. 6.1 ) are also displayed.
- 2606.26098v1: A Population of Little Red Dot-like Quasars in SDSS
A morphological analysis on a subset of LoRDs with HSC coverage shows that the majority of sources ( > 80 % >80\% ) are compact regardless of their spectral shape (see Section IV.1 ). We find that LoRDs with a V-shaped continuum are more likely to have a resolved morphology compared to sources without the V-shape. This suggests that some of the V-shaped spectra ( ∼ 40 % \sim 40\% ) are the result of an underlying stellar population and thus are unlikely to serve as proper LRD analogs. The remaining ∼ 60 % \sim 60\% of V-shaped LoRDs are proper LRD analog candidates, but space-based imaging is necessary to quantify their compactness.
- 2606.26098v1: A Population of Little Red Dot-like Quasars in SDSS
In this paper we have shown that the JWST filters used to select LRDs at z ∼ 5 z\sim 5 align well with the SDSS filters at both z = 0.38 z=0.38 and z = 0.78 z=0.78 . We leverage this mapping to photometrically select Local Red Dots (LoRDs) from SDSS using selection criteria similar to the red1/red2 criteria from Greene et al. [45] ; our selection is given in Equations 2 and 3 . In total we find ∼ 1300 \sim 1300 QSOs which share similar photometric colors to the LRDs (Section II.1 ). While not every LoRD we identify serves as a proper analog to LRDs, this is the first step towards studying LRD-like systems in the local Universe at the population level where archival data is plentiful.
Abstract
Little red dots (LRDs) are an intriguing new class of sources in the early universe discovered by the James Webb Space Telescope (JWST) characterized by V-shaped spectra and extremely compact sizes. Their underlying mechanisms still remain the subject of ongoing debate. We present JWST observations of a gravitationally lensed LRD nicknamed "Best Friend" at $z_{\rm spec} = 8.297\pm0.002$. Its high magnification factor of $μ= 36^{+8}_{-12}$ makes it the highest magnified LRD reported to date and unveils both the resolved structure of its host and a central engine less than 7 pc in size. The spectrum of the central engine, in which broad lines are not detected, possibly owing to the limited S/N and spectral resolution, is better interpreted as black hole activity rather than a dense star cluster. The latter cannot be fully excluded, but if true, the resulting lower limit on stellar density would be $>1.25^{+0.4}_{-0.3}\cdot10^6 \mathrm{M_{\odot}/pc}^2$, which is around 2 orders of magnitude higher than stellar densities of typical clusters at high-z. By performing a spatially resolved analysis of NIRCam photometry and NIRSpec/PRISM spectroscopy, we find that the host stellar mass is $\log(M_\star/M_{\odot}) = 7.3^{+0.2}_{-0.8}$. Best Friend demonstrates the power of lensing to reveal the morphologies of LRDs.
Discussion
Discussion access requires a security token. Register for the weekly digest.