2611.05349v1 · First listed 2026-11-04
UV spectra of little red dots: Broad-line N/C, gas recycling and black hole masses
For SPURS-GN-2 at z=7.19, broad UV nitrogen-to-carbon lines imply strongly CNO-processed, dense gas; ionization-ordered absorption velocities are interpreted as a near-Eddington, decelerating cocoon flow around a 10^6–10^7 solar-mass black hole. [1][6]
Evidence
The principal quantitative result is from one LRD, SPURS-GN-2: jointly fitting broad N III]/C III] and N IV]/C IV] ratios gives N/C = 12^(+3)_(-2) times solar and log n_e = 9.7^(+0.3)_(-0.5) cm^-3. The high N IV]/C IV ratio independently imposes n_e < 2 × 10^10 cm^-3. The authors argue that equal-charge N and C ions trace largely co-spatial gas in their Sirocco radiative-transfer simulations, enabling the joint density–abundance constraint. They infer roughly half of CNO nuclei were hydrogen-burned, with about 50% processed under CNO-cycle mixing (or 70% for CN-only mixing). [1][5][9]
Earlier work
The analysis extends earlier cocoon modeling rather than introducing the basic dense-cocoon picture: a previous Sirocco study inferred a sample median log(M_BH/M_sun) = 5.7 ± 0.8 after accounting for electron-scattering broadening, with near-Eddington accretion broadly implied. Here, the GN-2 UV absorption velocity ordering supplies a separate dynamical route to 10^6–10^7 M_sun. That comparison is model-dependent, but the two mass ranges overlap. The paper also cautions that apparent absorption-line optical-depth abundances need not equal intrinsic abundances because saturated, stratified lines can be refilled. [11][6][7]
What changes
Deep SPURS rest-UV spectra are used to connect broad-line abundance diagnostics with narrow absorption kinematics. In GN-2 and CEERS-7902, faster high-ionization absorption (for example C IV) than low-ionization Al II is matched by a radially decelerating, approximately ballistic model; for GN-2 the inferred effective gravity combined with luminosity favors near-Eddington accretion. The authors further interpret rapid cocoon-gas replacement and the nitrogen budget as favoring recycled gas—a partially failed wind—rather than a sustained escaping nitrogen-rich wind. [10][8]
Limits and open questions
The abundance measurement is quantitatively established only for GN-2, while the absorption-velocity trend is reported in two of four LRDs; the authors state that deep UV spectroscopy remains limited to a handful of objects. The black-hole mass is conditional on the Sirocco ballistic-flow geometry, bolometric luminosity, and radiation-force treatment; its stated uncertainty is likely no better than about 1 dex. Processed-gas fractions are lower limits under the adopted mixing assumptions, and saturated absorption makes direct elemental-abundance inference unreliable. [1][9][10][8]
The main paper has abstract and selected HTML extraction, including conclusion and key-results passages, but not a full methods or appendix extraction; figure assessments are therefore restricted to supplied captions and extracted text.
Key figures
![Figure 2. Figure 2: Nitrogen abundance in GN-2 broad-line gas.
Left panel: N/C versus electron-density from the N iii ]/C iii ] (blue) and N iv ]/C iv (green) flux ratios ( Tang et al. 2026a , see Fig. A.1 and) and atomic data alone. Red marks the joint constraint, vertical lines show the critical densities and dotted and dashed curves show the modest temperature dependence (from 10 000 K-30 000 K with fiducial T e = 15 000 T_{e}=15\,000 K). Middle panel: N/C-abundance in broad-line gas (red bar), in narrow-line LRDs ( Ji et al. 2026a ; Papovich et al. 2026 ; Tang et al. 2026a , red,) and in high-redshift N-emitters ( Schaerer et al. 2024 ; Naidu et al. 2026 , blue, compilation from) . Open circles highlight GN-2 and GN-z11 and the dashed line shows the locus of low- z z star-forming galaxies ( Nicholls et al. 2017 ) .
Right panel: N/C of solar-ratio gas mixed with a fraction f f of hydrogen-burning ash for the CN cycle (dashed) or the CNO cycle (solid), where the GN-2 broad-line ratios require f ≳ 0.5 f\gtrsim 0.5 .](/lrdigest/research/figures/2611.05349v1/figure-2-1.png?v=d1e872af81ed7fd7)
Tests the abundance result by intersecting N III]/C III] and N IV]/C IV density-dependent constraints, then compares GN-2 N/C with narrow-line LRDs and high-redshift nitrogen emitters; its mixing panel translates N/C into a processed fraction.
Original caption
Figure 2: Nitrogen abundance in GN-2 broad-line gas. Left panel: N/C versus electron-density from the N iii ]/C iii ] (blue) and N iv ]/C iv (green) flux ratios ( Tang et al. 2026a , see Fig. A.1 and) and atomic data alone. Red marks the joint constraint, vertical lines show the critical densities and dotted and dashed curves show the modest temperature dependence (from 10 000 K-30 000 K with fiducial T e = 15 000 T_{e}=15\,000 K). Middle panel: N/C-abundance in broad-line gas (red bar), in narrow-line LRDs ( Ji et al. 2026a ; Papovich et al. 2026 ; Tang et al. 2026a , red,) and in high-redshift N-emitters ( Schaerer et al. 2024 ; Naidu et al. 2026 , blue, compilation from) . Open circles highlight GN-2 and GN-z11 and the dashed line shows the locus of low- z z star-forming galaxies ( Nicholls et al. 2017 ) . Right panel: N/C of solar-ratio gas mixed with a fraction f f of hydrogen-burning ash for the CN cycle (dashed) or the CNO cycle (solid), where the GN-2 broad-line ratios require f ≳ 0.5 f\gtrsim 0.5 .
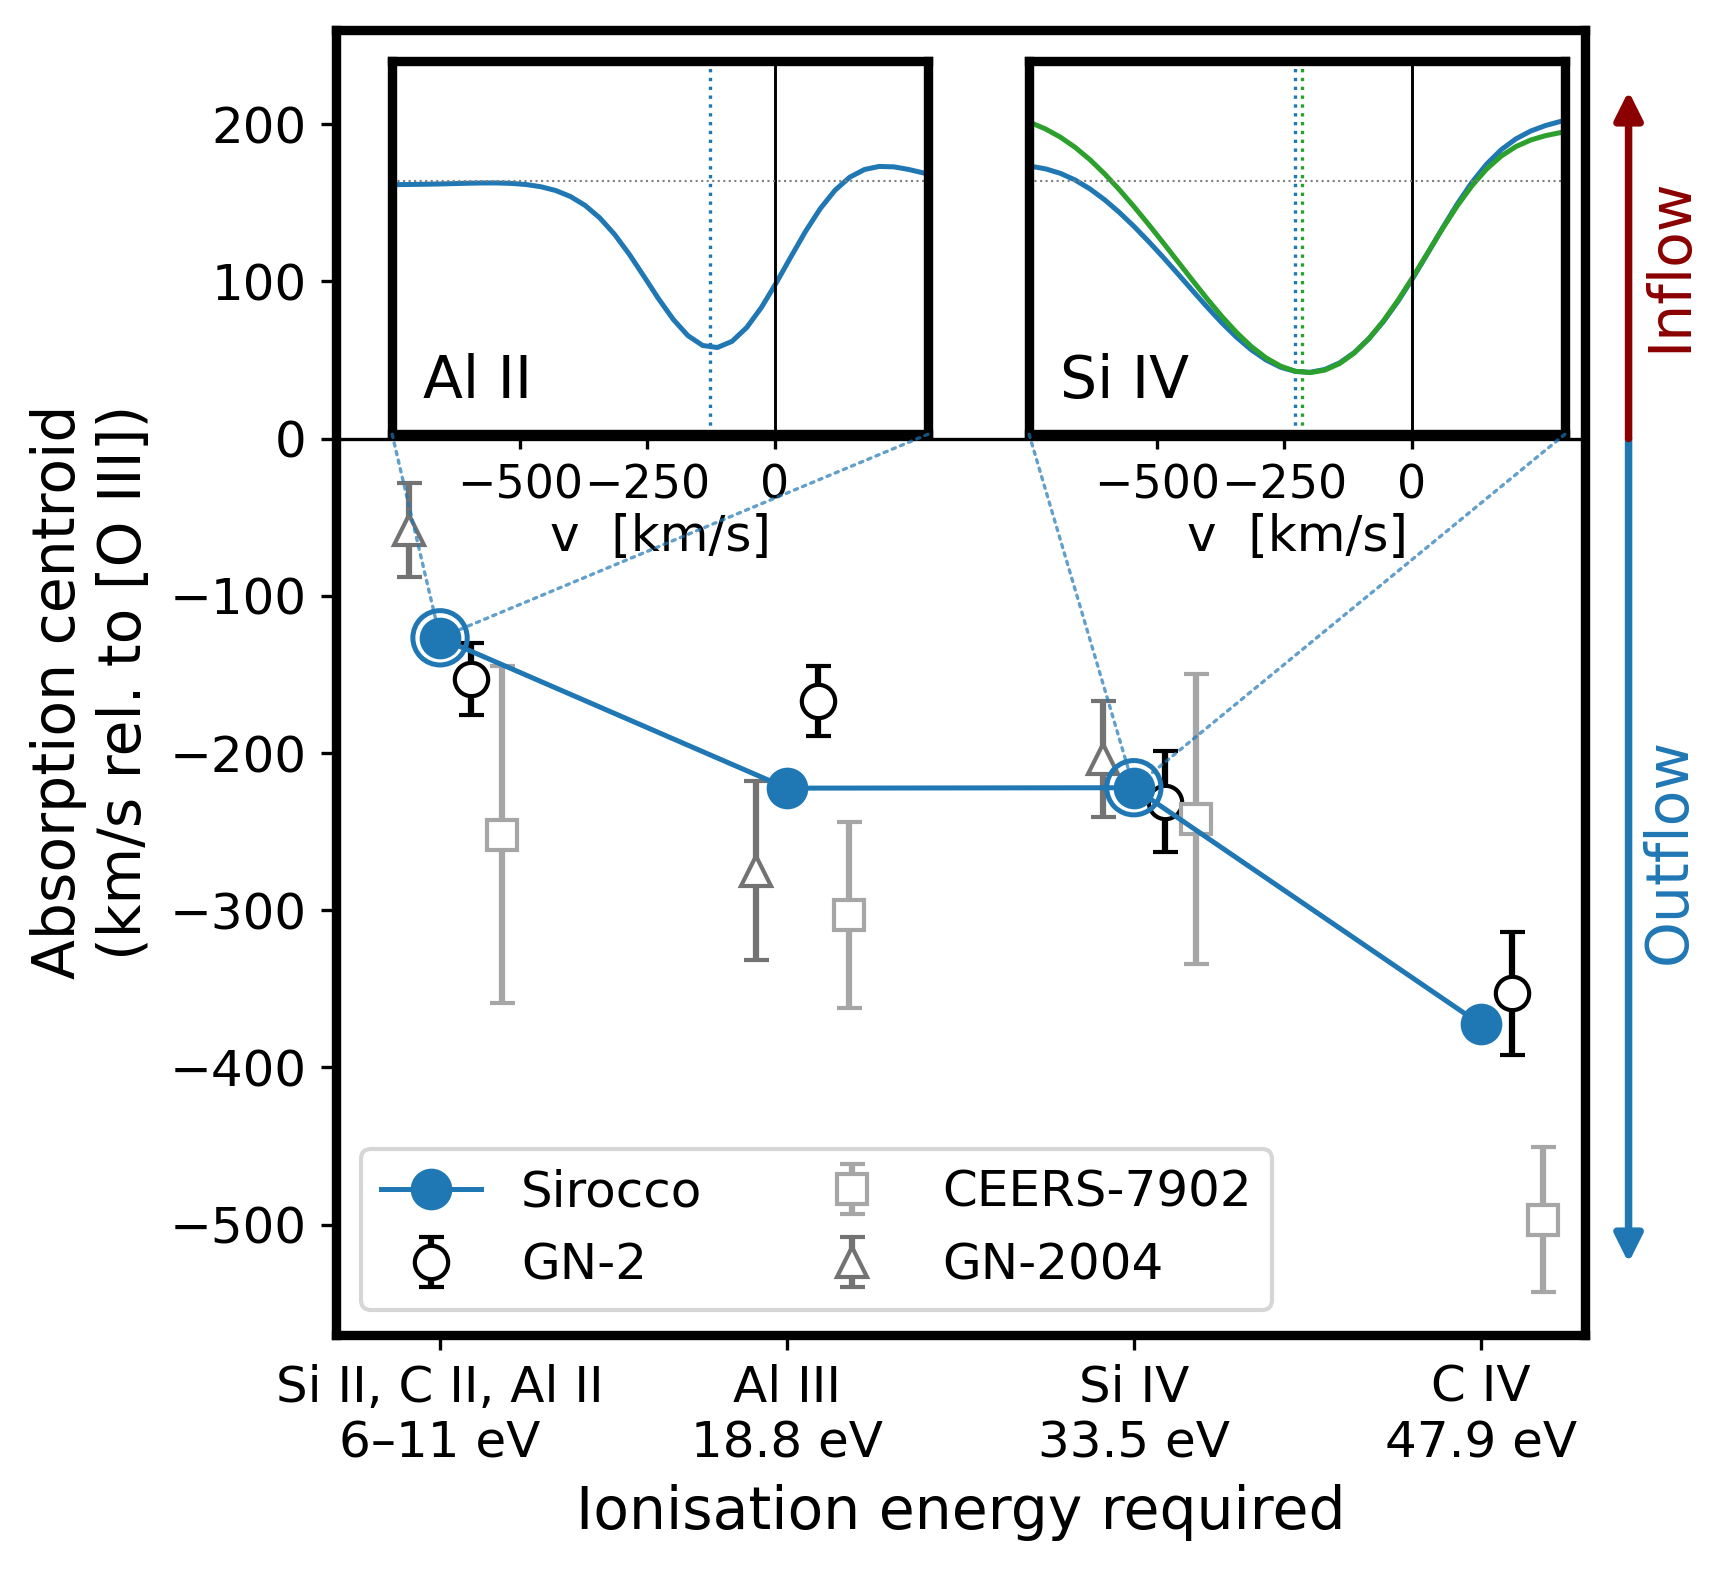
Tests whether absorption centroids systematically vary with ionization potential. GN-2 and CEERS-7902 show fast C IV and slow Al II, the ordering predicted by the model for gas whose velocity decreases outward.
Original caption
Figure 4: UV absorption velocity centroids for ions of increasing ionisation potential. From Tang et al. (2026a) , we show the absorption line velocity centroids for GN-2, CEERS-7902 and GN-2004. The insets illustrate the absorption-line profiles from Sirocco for the isolated lines of Al ii (at 1670.8 Å) and Si iv (at 1393.8 Å and 1402.8 Å), where a decreasing radial velocity profile produces faster outflows for the more centrally located higher ionisation states.
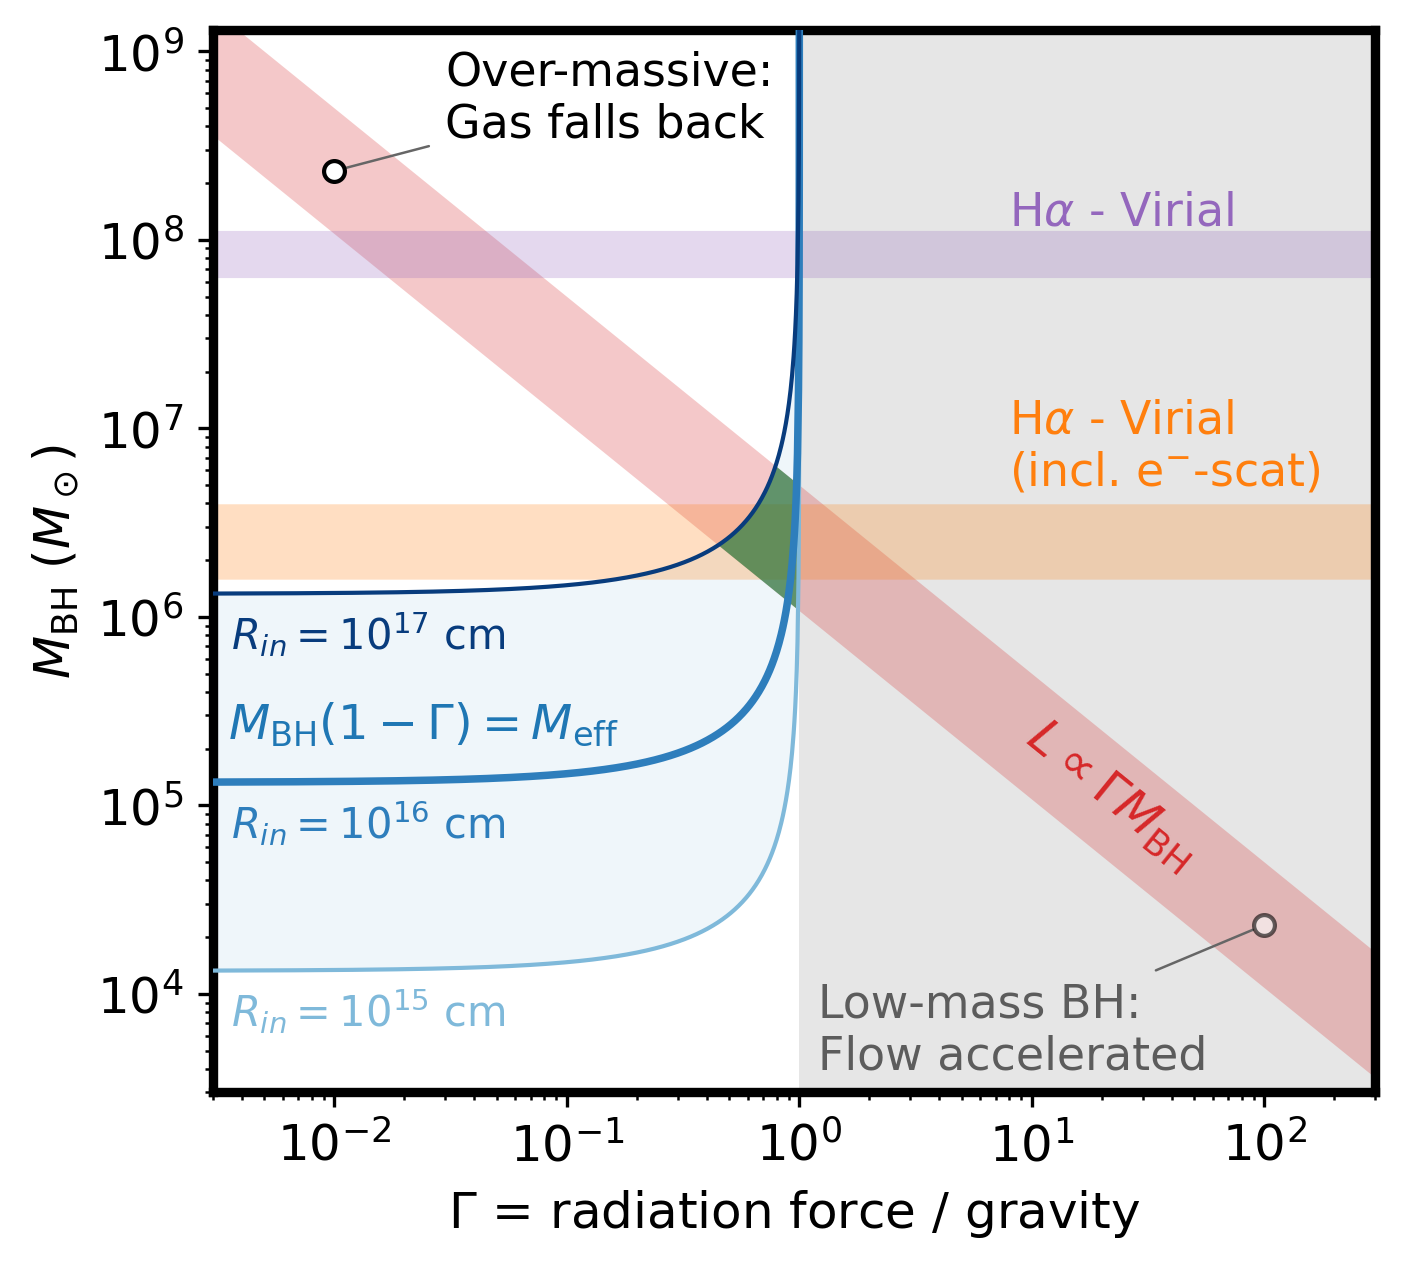
Tests the dynamical mass interpretation by intersecting luminosity-based ΓM_BH and deceleration-based M_BH(1−Γ) constraints, and contrasts them with broad-line estimates sensitive to electron-scattering broadening.
Original caption
Figure 6: Black hole mass constraints for ballistic wind in GN-2. The illustrative constraints from the bolometric luminosity ( ∝ Γ M BH \propto\Gamma M_{\rm BH} , red), the decelerating gas ( ∝ M BH ( 1 − Γ ) \propto M_{\rm BH}(1-\Gamma) , blue) and joint constraints (green), imply a limited range of allowed BH masses. Low-mass BHs ( ∼ 10 4 M ⊙ \sim 10^{4}\,M_{\rm\odot} ) become radiation-pressure dominated, while over-massive black holes ( ∼ 10 8 M ⊙ \sim 10^{8}\,M_{\rm\odot} ) would rapidly decelerate the gas. Mass constraints using the single-epoch virial H α \alpha estimator based on the full line width (purple) and from the electron-scattering decomposition ( Rusakov et al. 2026b ; Nikopoulos et al. 2026b ; Sneppen et al. 2026c , orange, following) calibrated on local AGN ( Reines & Volonteri 2015 , e.g.) are shown for comparison. The BH mass constraints from the ballistic wind model are only consistent when electron-scattering broadening is accounted for.
Related research
Previous digest
Sneppen et al. use Sirocco radiative-transfer models to interpret JWST/SPURS rest-UV broad emission and metal absorption features in four little red dots. Combining broad N IV]/C IV and N III]/C III] in SPURS-GN-2 at z=7.19 yields a dense broad-line region with log ne = 9.7 and a strongly supersolar N/C ratio of 12 times solar, implying that roughly half of its CNO nuclei have been through hydrogen burning and favoring rapid gas recycling. The absorption-line velocity sequence in two objects instead maps an ionization-stratified, gravitationally decelerating flow; for GN-2, its inferred dynamics point to near-Eddington radiation pressure around a 10^6-10^7 solar-mass black hole. The work links LRD nitrogen enrichment, cocoon kinematics, and black-hole mass constraints, while emphasizing that the typically saturated UV absorbers cannot provide direct abundance ratios on their own.
Sources and evidence (25)
- 2611.05349v1: UV spectra of little red dots: Broad-line N/C, gas recycling and black hole masses
Radiative-transfer models of supermassive black holes accreting inside dense gas cocoons reproduce the X-ray-to-near-infrared spectral energy distribution of "little red dots" (LRDs) using the code Sirocco. In the ultraviolet, these models also predict weak broad emission lines and a series of metal absorption lines, which deep spectroscopy from the JWST SPURS survey now detects in several LRDs. Here we use the models to interpret these features. We find that N and C ions of equal charge (3+ or 2+) occupy largely the same gas in the simulations, such that the combination of the broad N IV]/C IV and N III]/C III] flux ratios simultaneously constrains both the electron density and the N/C abundance ratio of the gas in the LRD proper. The nitrogen and carbon emission of SPURS-GN-2, an LRD at $z=7.19$, requires an order of magnitude nitrogen excess compared to the solar value, N/C $= 12^{+3}_{-2}$ (N/C)$_\odot$, in the broad-line gas with electron density $\log n_e = 9.7^{+0.3}_{-0.5}$ cm$^{-3}$. Thus, around half the broad-line CNO nuclei have passed through hydrogen burning. Because the ionised gas is replaced on a century timescale, sustaining this enrichment favours gas recycling. UV absorption lines test this independently. In two of the four LRDs, line blueshift velocities clearly increase with the photon energy required to ionise the absorber gas. In the models the absorption lines are spatially stratified, indicating that the gas is launched near the escape speed and slowed by gravity. In GN-2, where the measurement can be made, the inferred deceleration requires radiation pressure close to the Eddington limit of a $10^{6-7}$ M$_\odot$ black hole. The lines are also typically strongly saturated, making inferences of direct abundance ratios misleading.
- 2611.05349v1: UV spectra of little red dots: Broad-line N/C, gas recycling and black hole masses
Fig. 1 shows the spectrum of a model published previously ( Sneppen et al. 2026b ) , which reproduces typical optical features of LRD-like objects (e.g. Balmer broad line-width and line-absorption). Here we focus on the UV part, but generally emphasise that the modest metallicity at Z = 0.1 Z ⊙ Z=0.1\,Z_{\odot} is sufficient to produce both the observed metal features and hydrogen lines. Next we will address in turn the model predictions and the observational comparison of i) broad metal emission and ii) narrow metal absorption.
- 2611.05349v1: UV spectra of little red dots: Broad-line N/C, gas recycling and black hole masses
Deep rest-UV spectroscopy from SPURS resolves the stratified metal absorbers and weak broad emission lines anticipated by the Sirocco cocooned-AGN models. Interpreted within the radiative transfer framework, the data yields the following constraints.
- 2611.05349v1: UV spectra of little red dots: Broad-line N/C, gas recycling and black hole masses
The broad N iii ]/C iii ] and N iv ]/C iv ratios of GN-2 indicate N/C = 12 − 2 + 3 ( N / C ) ⊙ =12_{-2}^{+3}\,(\mathrm{N/C})_{\odot} in the broad-line gas, matching its narrow-line values for the same lines and placing the LRD proper among the high-redshift N-emitters. About half or more of CNO nuclei have been through hydrogen burning. Given the short depletion times of the broad-line proper, this provides a progenitor-independent limit for the preceding stellar enrichment. An escaping wind and a sustained nitrogen-rich phase ( t N ∼ 10 t_{N}\!\sim\!10 Myr) are not compatible with the M U V M_{UV} stellar - mass limit.
- 2611.05349v1: UV spectra of little red dots: Broad-line N/C, gas recycling and black hole masses
The high ratio of N iv ]/C iv puts an upper bound on the emitting region’s electron density, n e < 2 × 10 10 cm − 3 n_{e}<2\times 10^{10}\,{\rm cm^{-3}} , which disfavours models with large clumping factors (e.g., by factors ≳ 20 \gtrsim 20 ).
- 2611.05349v1: UV spectra of little red dots: Broad-line N/C, gas recycling and black hole masses
Absorption line velocities are ordered by ionisation potential (e.g. fast C iv and slow Al ii in GN-2 and CEERS-7902) indicating a velocity law that decreases outward in the models. A ballistic flow coasting near the escape speed reproduces this ordering, and implies M BH ≃ 10 6 − 7 M ⊙ M_{\mathrm{BH}}\simeq 10^{6-7}\,\mathrm{M_{\odot}} and near-Eddington accretion.
- 2611.05349v1: UV spectra of little red dots: Broad-line N/C, gas recycling and black hole masses
Apparent optical-depth abundances do not reflect the input abundance of the Sirocco models due to spatial stratification and refilled saturated line troughs. A cocoon with solar abundances and saturated lines naturally reproduces Al-rich, Mg-poor absorption pattern reported for LRDs (see Kokorev et al. 2026 , and App. A ) .
- 2611.05349v1: UV spectra of little red dots: Broad-line N/C, gas recycling and black hole masses
Recycled gas is favoured by diagnostics in both emission (the nitrogen budget) and absorption (marginally bound, decelerating flow). Thus, the LRD cocoon may be a partially failed wind, where feedback at near - Eddington luminosity lifts hydrogen - burnt gas, which falls back and is re - accreted. Deep rest - UV spectroscopy of LRDs is still limited to a handful of objects. The far-reaching conclusions that can be drawn in this regime and exemplified here suggest that significantly larger UV observational samples will be important to understand the LRD phenomenon.
- 2611.05349v1: UV spectra of little red dots: Broad-line N/C, gas recycling and black hole masses
The observed N / C = 12 − 2 + 3 ( N / C ) ⊙ {\rm N/C=12_{-2}^{+3}\,(N/C)_{\odot}} lies far above ordinary enrichment ( Nicholls et al. 2017 ) and far below the hydrogen burning equilibrium ( Arnould et al. 1999 , ≳ 100 ( N / C ) ⊙ \,\gtrsim\!100\,{\rm(N/C)_{\odot}} , see) , so this requires a mixture of processed and unprocessed material. The carbon share probes the processed fraction directly. CNO burning converts the polluters’ own initial carbon and oxygen into nitrogen while conserving C+N+O ( Charbonnel et al. 2023 ; Higgins et al. 2025 ) . Fig. 2 (right panel), which mixes solar-scaled gas with ash at hydrogen-burning equilibrium, illustrates that the observed N / C {\rm N/C} implies f ≈ 50 % f\approx 50\% has passed through the CNO cycle, or f ≈ 70 % f\approx 70\% if only the CN cycle is considered. The absence of broad O iii ] λ 1666 \lambda 1666 and the high implied N/O ratio favour the former (App. A ). In every other respect f f is a lower limit. Wolf-Rayet winds can add helium-burning carbon ( Charbonnel et al. 2023 ) , which would only lower N/C at fixed f f . Metal-poor unprocessed gas starts with a lower N/C than the solar-scaled ratios adopted here, so the same observed ratio would require more processing. Ash that has not reached equilibrium would require more still. We emphasise these abundance ratios are largely independent of metallicity. From these extreme processed fractions, the limited UV luminosity, and the rapid turnover rate of the cocoon gas, we can infer whether the cocoon gas must be recycled, rather than purely fed-in and ejected, as follows.
- 2611.05349v1: UV spectra of little red dots: Broad-line N/C, gas recycling and black hole masses
Several, often saturated, narrow absorption features are produced by the metal ions in the enshrouding gas in Sirocco models. Because the ionisation states are radially stratified, a velocity field that changes with radius gives a systematic difference in their line velocity centroids (Fig. 4 ). In the models, the velocity gradient of these lines with increasing ionisation state is i) positive for a decelerating flow, indicating a gas outflow coasting in the SMBH gravitational potential or ii) negative for an accelerating flow such as from a radiatively-driven flow. The observations of GN-2 and CEERS-7902 show the former with fast C iv and slow Al ii (for the saturated Mg ii , see App. A ). Sirocco reproduces this ordering with a ballistic law in which gas coasts near the local escape speed with an effective gravity M eff ∼ 10 5 M ⊙ M_{\rm eff}\sim 10^{5}\,\mathrm{M_{\odot}} (see Fig. 5 ). The effective mass is not the black-hole mass but the residual of gravity and radiation pressure, M eff = M BH ( 1 − Γ ) M_{\rm eff}=M_{\rm BH}(1-\Gamma) , with Γ \Gamma being the ratio of the forces. By definition Γ ∼ 1 \Gamma\!\sim\!1 close to the Eddington accretion limit and indeed is in the Sirocco model in Fig. 5 , when its own radiation field is used to compute the radiation force. For the model in Fig. 5 with a representative LRD luminosity L = 10 44 L=10^{44} erg s -1 this requires M BH ≃ ( 1 − 2 ) × 10 6 M ⊙ M_{\rm BH}\simeq(1{-}2)\times 10^{6}\,\mathrm{M_{\odot}} . For comparison, an over-massive SMBH ( ∼ 10 8 M ⊙ , Γ ∼ 0.01 \sim 10^{8}\,\mathrm{M_{\odot}},\Gamma\sim 0.01 ), by definition very sub-Eddington at these luminosities, would decelerate the flow immediately, whereas a low-mass black hole (e.g. ∼ 10 4 M ⊙ , Γ ∼ 100 \sim 10^{4}\,\mathrm{M_{\odot}},\Gamma\sim 100 ) would not decelerate the flow at all and be dominated by the radiation field (see Fig. 6 ). Within the Sirocco framework, the proposed black hole mass estimate is uncertain to the same level as the bolometric luminosity and is thus likely robust to ≲ \lesssim 1 dex (see App. B ). This SMBH mass estimate is significantly below broad line virial estimates for LRDs ( Maiolino et al. 2026 ; D
- 2601.18864v1: Inside the cocoon: a comprehensive explanation of the spectra of Little Red Dots
Accounting for electron-scattering broadening, we find the intrinsic width of the broad lines in our sample. Standard AGN scaling relations ( [ 65 ] ) imply SMBH masses log 10 ( M / M ⊙ ) = 5.0 − 7.0 \log_{10}(M/M_{\odot})=5.0{-}7.0 . By contrast, Sirocco does not rely on a luminosity–size scaling: the recombination luminosity and measured column density set the cocoon scale, while the unscattered broad-line width gives the Keplerian velocity at that scale. Matching the unscattered components in the sample to our models yields log 10 ( M / M ⊙ ) = 5.7 ± 0.8 \log_{10}(M/M_{\odot})=5.7\pm 0.8 (median with 1 σ \sigma percentiles). For our sample luminosities, this implies Eddington ratios of log 10 ( L / L e d d ) = − 0.2 − 0.9 + 1.2 \log_{10}(L/L_{edd})=-0.2_{-0.9}^{+1.2} , implying that most of our sample is accreting close to the Eddington limit. The mass of gas in the ionized cocoon is small: 1 − 100 1-100 M ⊙ (see Sect. B.3 ). Typical electron temperatures vary across the cocoon from about 4000 K to about 10 000 K. The hydrogen column densities range from about 10 24 10^{24} cm -2 to a few 10 25 10^{25} cm -2 . As mentioned above the dust content in the ionized cocoon is extremely low, essentially negligible. Velocities are ≲ 100 \lesssim 100 km s -1 in the inflow, up to 400 km s -1 in the outflow and these two components contain comparable mass-flows.
- 2601.18864v1: Inside the cocoon: a comprehensive explanation of the spectra of Little Red Dots
consistent with the reverberation-tracked photon delays in the Sirocco models. Multi-epoch JWST studies find LRDs are photometrically steady as a population ( [ 34 , 69 ] ), although individual lensed systems do vary: A2744-QSO1 shows broad-line equivalent-width changes at the ∼ 20 % \sim 20\% level over 2.4 yr rest-frame ( [ 70 ] ), and R2211-RX1 shows intrinsic colour and brightness variations on 10–100 yr timescales ( [ 71 ] ). A prediction of our model is that variability should appear on longer timescales only, and most strongly in the unscattered cores of the broad lines.
- 2503.16595v1: Little red dots as young supermassive black holes in dense ionized cocoons
All best-fit results in this paper were produced using the Monte Carlo Markov Chain (MCMC) NUTS sampler in PyMC v. 5.17.0 [ 16 ] , except Objects A and D, which were fitted using the Ensemble sampler in emcee v. 3 [ 17 ] (due to an incompatibility of the P Cygni model used here with the tensor formalism in PyMC ). We sampled the posterior distributions with 4 k 4k walkers (where k k is the number of free parameters) and 10 5 10^{5} samples per walker. We use the mode values of the posterior parameter distributions as the best values and the 68%-highest density interval as the range of uncertainty. Finally, we find that the resolution of NIRSpec gratings is higher than the nominal value. Using the resolved widths of narrow [O iii ] lines in the high-resolution G235H grating of Object A, we estimate that the medium resolution grating G235M has ∼ 1.7 \sim 1.7 times higher R R than the nominal value. This scaling factor on R R has been assumed for G395M and also for the G395H grating, as supported by recent instrument modelling [ 18 ] for a point source.
- 2503.16595v1: Little red dots as young supermassive black holes in dense ionized cocoons
The high density gas reprocesses essentially all of the Lyman continuum radiation from the central source, resulting in extremely high Lyman optical depths that cause the self-reversal seen as absorption in the line centres of some of the Balmer lines. The bulk of the ionizing flux from the AGN is therefore emitted in the Balmer and Paschen regions of the spectrum, implying that nebular gas emission must be a major component of the optical and NIR spectra of these sources, giving rise to Balmer, Paschen and He i emission lines and continua and the two-photon continua that would dictate the spectral shape [ 13 , 40 ] . In addition, while many of these systems appear in blue star-forming galaxies based on the spatially-extended nebulosity surrounding the point source [ 41 ] , many may be entirely dominated by the nebular emission at optical and even near UV wavelengths. We also note that our inferred electron-scattering optical depths are all τ e ∼ 1 \tau_{e}\sim 1 (see Extended Data Fig. 8 ). This suggests three things. First, that there may be a population that is even more heavily obscured, suppressing line emission due to self-absorption, and giving rise to spectra that appear in absorption rather than emission, including a Balmer break instead of a jump. Second, it also suggests that the gas distribution is close to spherical without a large opening, because scattered light will be preferentially emitted along the lowest column density sightlines. The fact that we are not detecting large numbers of low-mass, rapidly accreting AGN without these signatures indicates that LRDs are the primary population and that the gas cocoon in these SMBHs is a near-universal, young phase of their accretion-powered growth. Third, that the line ratios of the Balmer lines should be very different from the standard case B values due to very high Lyman optical depths [ 42 ] , so that high H α \alpha /H β \beta ratios do not imply dust extinction.
- 2609.20920v1: Little Red Dots As Super-Eddington Fountain Flows
Figure 1 is an infographic that summarizes the salient features of our model, which we list here:
- 2609.20920v1: Little Red Dots As Super-Eddington Fountain Flows
The slow outflows of LRDs pose an energy-budget problem for super-Eddington accretion models that requires an off-axis line of sight (Sec. II , Fig. 1 - 2 ). LRDs show slow, ∼ 100 − 300 km s − 1 \sim 100-300\,{\rm km\,s^{-1}} outflows, yet a super-Eddington torus must shed most of its viscously generated energy into far faster winds, ≳ 10 3 − 10 4 km s − 1 \gtrsim 10^{3}-10^{4}\,{\rm km\,s^{-1}} . Since we observe slow gas, the fast wind must escape near the poles where it is collimated into funnels, while we view the system off-axis.
- 2602.06024v1: Water absorption confirms cool atmospheres in two little red dots
We now consider the results in the context of the broader sample. Within the high signal-to-noise sample at 2 < z < 3 2<z<3 , two out of four objects show clear water absorption, while the others have similar overall SEDs but appear modestly bluer (see Methods). Compared to the broader LRD population spanning z ∼ 2 − 7 z\sim 2-7 (Fig. 3 ), the two objects studied here have consistent bolometric luminosities, but lie toward the redder end of the color distribution and colder end of the inferred temperature distribution. If the thermal interpretation of the rest-frame optical spectra of LRDs is correct, the reddest LRDs should also be the coolest Barro et al. (2025) ; de Graaff et al. (2025) ; Umeda et al. (2025) , in tentative agreement with our findings.
- 2602.06024v1: Water absorption confirms cool atmospheres in two little red dots
The exact threshold value of − 0.2 -0.2 for r H 2 O r_{\rm H_{2}O} is chosen to minimize contamination from sources whose apparent signal arises from a sloping continuum rather than from a genuine absorption feature. The precise numerical value is not critical for the conclusions of this paper, especially given the limited sample size. Four out of the eight LRDs satisfy the S/N requirement. The generally low S / N \mathrm{S/N} across the broader sample arises primarily from increased noise near the detector edge of NIRSpec. Applying the r H 2 O r_{\rm H_{2}O} selection yields two sources, namely WIDE-EGS-2974 and UNCOVER-A2744-20698. We visually inspect both spectra to confirm the presence of water absorption. The r H 2 O r_{\rm H_{2}O} values for WIDE-EGS-2974 and UNCOVER-A2744-20698 are -0.32 and -0.20, respectively. In summary, water absorption is detected in two out of the four LRDs for which the spectral coverage and S/N allow such a feature to be measured.
- 2508.08768v1: Impact of Resonance, Raman, and Thomson Scattering on Hydrogen Line Formation in Little Red Dots
Little Red Dots (LRDs) are compact sources at $z>5$ discovered through JWST spectroscopy. Their spectra exhibit broad Balmer emission lines ($\gtrsim1000\rm~km~s^{-1}$), alongside absorption features and a pronounced Balmer break -- evidence for a dense, neutral hydrogen medium with the $n=2$ state. When interpreted as arising from AGN broad-line regions, inferred black hole masses from local scaling relations exceed expectations given their stellar masses, challenging models of early black hole-galaxy co-evolution. However, radiative transfer effects in dense media may also impact the formation of hydrogen emission lines. We model three scattering processes shaping hydrogen line profiles: resonance scattering by hydrogen in the $n=2$ state, Raman scattering of UV radiation by ground-state hydrogen, and Thomson scattering by free electrons. Using 3D Monte Carlo radiative transfer simulations with multi-branching resonance transitions, we examine their imprint on line shapes and ratios. Resonance scattering produces strong deviations from Case B flux ratios, clear differences between H$α$ and H$β$, and encodes gas kinematics in line profiles but cannot broaden H$β$ due to conversion to Pa$α$. While Raman scattering can yield broad wings, scattering of UV continuum is disfavored given the absence of strong FWHM variations across transitions. Raman scattering of higher Lyman-series emission can produce H$α$/H$β$ wing width ratios of $\gtrsim1.28$, agreeing with observations. Thomson scattering can reproduce the observed $\gtrsim1000~\rm km\, s^{-1}$ wings under plausible conditions, e.g., $T_{\rm e} \sim 10^4\rm \, K$ and $N_{\rm e}\sim10^{24}\rm~cm^{-2}$ -- and lead to black hole mass overestimates by factors $\gtrsim10$. Our results provide a framework for interpreting hydrogen lines in LRDs and similar systems.
- 2602.20247v1: Little Red Dots: One Photometric Tag Concealing Diverse Spectroscopic Flavors of Massive Star Formation and Black Hole Activity
Figure 15: Comparison of the BH and stellar masses for our stacks are shown with filled hexagons in colors, each one representing a different LRD subtype. Open hexagons show results if we consider that 50% of the bolometric luminosity of the LRD core is linked to stellar emission (see text for details). Open hexagons show results for our stacks using a calibration based on BH masses from single-epoch Balmer line data. We also show with a shaded area the z = 0 z=0 AGN in Reines and Volonteri [186] , and with brown lines the relationships found by Greene et al. [84] for all (continuous line), early-type (dotted), and late-type (dash-dot) z = 0 z=0 galaxies. The dots in black and gray depict the AGN in Jones et al. [110] , LRDs and non-LRDs, respectively. The squares are the AGN in Rusakov et al. [193] . The open triangles depict the AGN in Ma et al. [144] . Dashed oblique lines mark specific BH-to-stellar mass ratios.
- 2602.20247v1: Little Red Dots: One Photometric Tag Concealing Diverse Spectroscopic Flavors of Massive Star Formation and Black Hole Activity
We remark several points about this comparison. First, we are comparing total stellar masses for galaxies with BH masses. If LRDs probe the early formation of bulges, we should compare with results in, e.g., Kormendy and Ho [121] , which obtain larger BH-to-stellar mass ratios (as high as 0.7%). These ratios would be more consistent with our measurements for LRDs, especially if the LRD core is not completely dominated by an AGN but has some stellar contribution (cf. open hexagons in Figure 15 ).
- 2608.25021v1: The ionizing properties of JWST's compact broad-line emitters
The resulting escaping ionizing-photon production rate density at z = 5 z=5 is log ( N ˙ ion / s − 1 Mpc − 3 ) = 50.82 − 0.17 + 0.14 \log(\dot{N}_{\rm ion}/\mathrm{s^{-1}\,Mpc^{-3}})=50.82^{+0.14}_{-0.17} , consistent with the ionizing emissivity inferred from the Ly α \alpha forest at these redshifts ( Becker and Bolton, 2013 ) . Uncertainties are the 68 % 68\% confidence intervals from a Monte Carlo propagation of the uncertainties in the adopted f esc f_{\mathrm{esc}} , ξ ion \xi_{\rm ion} , L UV / L H α L_{\rm UV}/L_{\rm H\alpha} conversions, LF normalizations, and the AGN/non-AGN split. Star-forming galaxies supply the bulk of this budget ( ≈ 92.5 − 8 + 4 % \approx 92.5^{+4}_{-8}\% ), while the full broad-line population contributes ≈ 5 % \approx 5\% . Within the latter, the compact blue BLEs dominate ( ≈ 3.9 − 2 + 6 % \approx 3.9^{+6}_{-2}\% of the total), whereas the AGN and the LRDs contribute only ≈ 0.9 − 0.7 + 2 % \approx 0.9^{+2}_{-0.7}\% and ≈ 0.3 − 0.3 + 5 % \approx 0.3^{+5}_{-0.3}\% respectively. As expected by the correlation between Balmer break and f esc f_{\mathrm{esc}} , although the LRDs contribute the most to the broad-H α \alpha LF, they are negligible reionizers. The broad-line contribution to reionization is therefore carried almost entirely by the minority of low-column sources. We consider this the “fiducial” model. Its principal uncertainty is precisely the composition of the broad-line population below our completeness limit, which the luminosity split fixes by construction. Adopting instead an equal split between AGN and non-AGN broad-line emitters, the latter divided between LRDs ( 33.5 % 33.5\% ) and compact blue BLEs ( 16.5 % 16.5\% ), raises the broad-line share of the ionizing budget to 11.8 − 6.2 + 10.8 % 11.8^{+10.8}_{-6.2}\% , with the AGN term alone growing from 0.9 % 0.9\% to ∼ 8 % \sim 8\% . The two scenarios differ by a factor of ∼ 2.5 \sim 2.5 in broad-line emissivity while remaining statistically consistent with one another. Both scenarios fall well short of the ≳ 50 % \gtrsim 50\% required for AGN-dominated reionization ( Madau et al., 2024 ) , but a ∼ 5 % \sim 5\% contribution is non-negligible, particularly tow
- 2608.25021v1: The ionizing properties of JWST's compact broad-line emitters
What fraction of sources exhibit bright, blue UV emission that is predominantly powered by the same region as the broad lines? Starting from a parent sample of 4145 galaxies with simultaneous Ly α \alpha -to-H α \alpha coverage, we identify 99 broad-line emitters, of which only 20 ( ≈ 20 \approx 20 %) satisfy our combined blue-slope and UV/optical compactness criteria (Sect. 3 ). Although the PRISM broad-line selection is incomplete and biased toward luminous, red sources – so this fraction is a lower limit (Sect. 3.1 ) – compact blue BLEs represent a genuine minority of the BLE population, consistent with the geometric expectation from our viewing-angle picture (Sect. 6.1 ). We emphasize, however, that the adopted thresholds ( β UV ≤ − 1.5 \beta_{\rm UV}\leq-1.5 and β opt < 0.5 \beta_{\rm opt}<0.5 ) are somewhat arbitrary: in the viewing-angle framework, the transition from compact blue BLE to LRD spectral types is continuous rather than discrete, with the observed β UV \beta_{\rm UV} and β opt \beta_{\rm opt} varying smoothly as a function of the line-of-sight column density (Sect. 5.2 ).
- 2605.15263v1: On the quenching of LRD X-ray emission by both Compton-thick gas and high accretion rates
In Fig. 2 , we illustrate the parameters that shape the X-ray emission, namely the intrinsic X-ray SED, the column density, and the gas composition. Increasing the column density increases the Balmer-break strength and shifts the X-ray emission to lower energies through enhanced Compton scattering. However, the relationship between the X-ray suppression and UV attenuation as inferred from the Balmer break is complex and non-monotonic. Larger Balmer breaks do not necessarily imply weaker X-ray flux at a fixed energy below the Compton hump as Compton down-scattering redistributes photons into lower-energy bands. As a result, depending on the bandpass considered and the metallicity of the gas, the X-ray suppression, T X T_{\mathrm{X}} , can be either greater or less than the UV attenuation suggested from the Balmer-break strength.
- 2605.15263v1: On the quenching of LRD X-ray emission by both Compton-thick gas and high accretion rates
The cocoon composition strongly affects the degree of photoelectric absorption. An order-of-magnitude increase in metallicity leads to a factor of ∼ 2 \sim 2 increase in the Compton peak energy and a factor of ∼ 3 \sim 3 decrease in the peak transmitted fraction. These emergent spectral properties depend non-linearly on metallicity, because the transmitted spectrum is shaped by exponential photoelectric attenuation and Compton reprocessing. The underlying X-ray photoelectric optical depth, τ X \tau_{\mathrm{X}} , however, scales approximately linearly with metallicity, since absorption at the relevant X-ray energies is dominated by metals. Equivalently, the solar-abundance-equivalent X-ray column density is N H X ( Z ) = ( τ X / τ X ⊙ ) N H ∼ ( Z / Z ⊙ ) N H N_{\mathrm{H_{X}}(Z)}=(\tau_{\mathrm{X}}/\tau_{\mathrm{X_{\odot}}})N_{\mathrm{H}}\sim(Z/Z_{\odot})N_{\mathrm{H}} . Very low metallicities, either pristine formation values Z / Z ⊙ ≲ 10 − 5 Z/Z_{\odot}\lesssim 10^{-5} invoked in direct-collapse black-hole scenarios ( Clark et al. 2008 ; Cenci & Habouzit 2025 , e.g.) , or enriched values Z / Z ⊙ ≲ 5 × 10 − 3 Z/Z_{\odot}\lesssim 5\times 10^{-3} ( Pacucci et al. 2026 ) , imply weak photoelectric absorption and therefore only modest attenuation in the observed-frame 0.5–5 keV band. The lack of detection in X-rays therefore suggests that the gas in LRDs is not extremely metal poor, if LRDs have NLS1 or brighter AGN at their hearts.
Abstract
Radiative-transfer models of supermassive black holes accreting inside dense gas cocoons reproduce the X-ray-to-near-infrared spectral energy distribution of "little red dots" (LRDs) using the code Sirocco. In the ultraviolet, these models also predict weak broad emission lines and a series of metal absorption lines, which deep spectroscopy from the JWST SPURS survey now detects in several LRDs. Here we use the models to interpret these features. We find that N and C ions of equal charge (3+ or 2+) occupy largely the same gas in the simulations, such that the combination of the broad N IV]/C IV and N III]/C III] flux ratios simultaneously constrains both the electron density and the N/C abundance ratio of the gas in the LRD proper. The nitrogen and carbon emission of SPURS-GN-2, an LRD at $z=7.19$, requires an order of magnitude nitrogen excess compared to the solar value, N/C $= 12^{+3}_{-2}$ (N/C)$_\odot$, in the broad-line gas with electron density $\log n_e = 9.7^{+0.3}_{-0.5}$ cm$^{-3}$. Thus, around half the broad-line CNO nuclei have passed through hydrogen burning. Because the ionised gas is replaced on a century timescale, sustaining this enrichment favours gas recycling. UV absorption lines test this independently. In two of the four LRDs, line blueshift velocities clearly increase with the photon energy required to ionise the absorber gas. In the models the absorption lines are spatially stratified, indicating that the gas is launched near the escape speed and slowed by gravity. In GN-2, where the measurement can be made, the inferred deceleration requires radiation pressure close to the Eddington limit of a $10^{6-7}$ M$_\odot$ black hole. The lines are also typically strongly saturated, making inferences of direct abundance ratios misleading.
Discussion
Discussion access requires a security token. Register for the weekly digest.