2603.24739v1 · First listed 2026-03-25
A striking excess of red quasars with steep radio spectral slopes: a dusty blow-out phase revealed through AGN-driven shocks?
Across SDSS quasars at 0.2<z<2.4, compact red quasars show an excess near α1.4–3 GHz≈−1 that strengthens with dust extinction. The authors interpret this as wind/jet–ISM shocks during a dusty blow-out phase, but radio spectra alone do not establish that mechanism. [1][8]
Evidence
The study compares 573 red quasars (rQSOs) with 1,278 typical blue control quasars (cQSOs), selected from SDSS over 0.2<z<2.4, using 144 MHz LoTSS, 1.4-GHz FIRST, and 3-GHz VLASS data. The authors visually classify radio morphology, retaining sources compact (<6 arcsec) at all three frequencies as “truly compact”; ambiguous images, artefacts, or confusing counterparts are excluded. The reported excess is specifically in truly compact rQSOs, at α1.4–3 GHz≈−1 under Sν∝να, rather than in cQSOs or rQSOs extended at low frequency. A bimodal fit finds the steep component’s share rises from about 10% at E(B−V)<0.1 to about 33–35% at E(B−V)≥0.2. For the dustiest steep-spectrum objects, 86^{+5}_{−21}% are consistent with a wind-shock luminosity prediction assuming wind efficiency up to 7%. [1][5][6]
Earlier work
A concrete comparison is available with an earlier SED study of 63 heavily reddened quasars at z=0.7–2.7 and E(B−V)=0.4–1.8. That work inferred hot-dust deficits and proposed dust ejection by AGN feedback; this paper instead tests a larger, partly lower-redshift optically selected sample with resolved multi-frequency radio morphology and spectral slopes. The two studies therefore support compatible evolutionary interpretations, but neither alone demonstrates feedback causality. [22][1]
What changes
The key advance is separating high-frequency-compact sources from those extended in LoTSS: roughly 17% of FIRST-compact rQSOs and 27% of FIRST-compact cQSOs are low-frequency extended. This distinction confines the dust–radio correlation to truly compact sources. The steep rQSO subpopulation also has flatter low-frequency slopes than its 1.4–3-GHz slopes, so the authors identify intermediate-frequency observations as necessary to resolve its spectral origin rather than treating the shock interpretation as unique. [3][8][10]
Limits and open questions
The morphology result is conditional on visual classifications and quality cuts: about 10% of initially inspected cQSOs and 9.3% of rQSOs were removed, although the similar removal rates reduce concern about a differential cut bias. “Compact” is limited by survey resolution, not a direct physical size measurement. The extinction trends are correlations, and the 86% wind-shock figure is model-dependent—radio luminosities are consistent with, not proof of, a ≤7% efficiency wind. Spectral curvature between 144 MHz and 3 GHz remains unresolved without intermediate-frequency data. [5][8][1]
Evidence includes the abstract, selected full-text HTML passages, and a supplied caption list, but not the complete paper tables, fitted-parameter tables, or all methods sections. Figure notes are therefore restricted to caption-level tests and extracted discussion.
Key figures
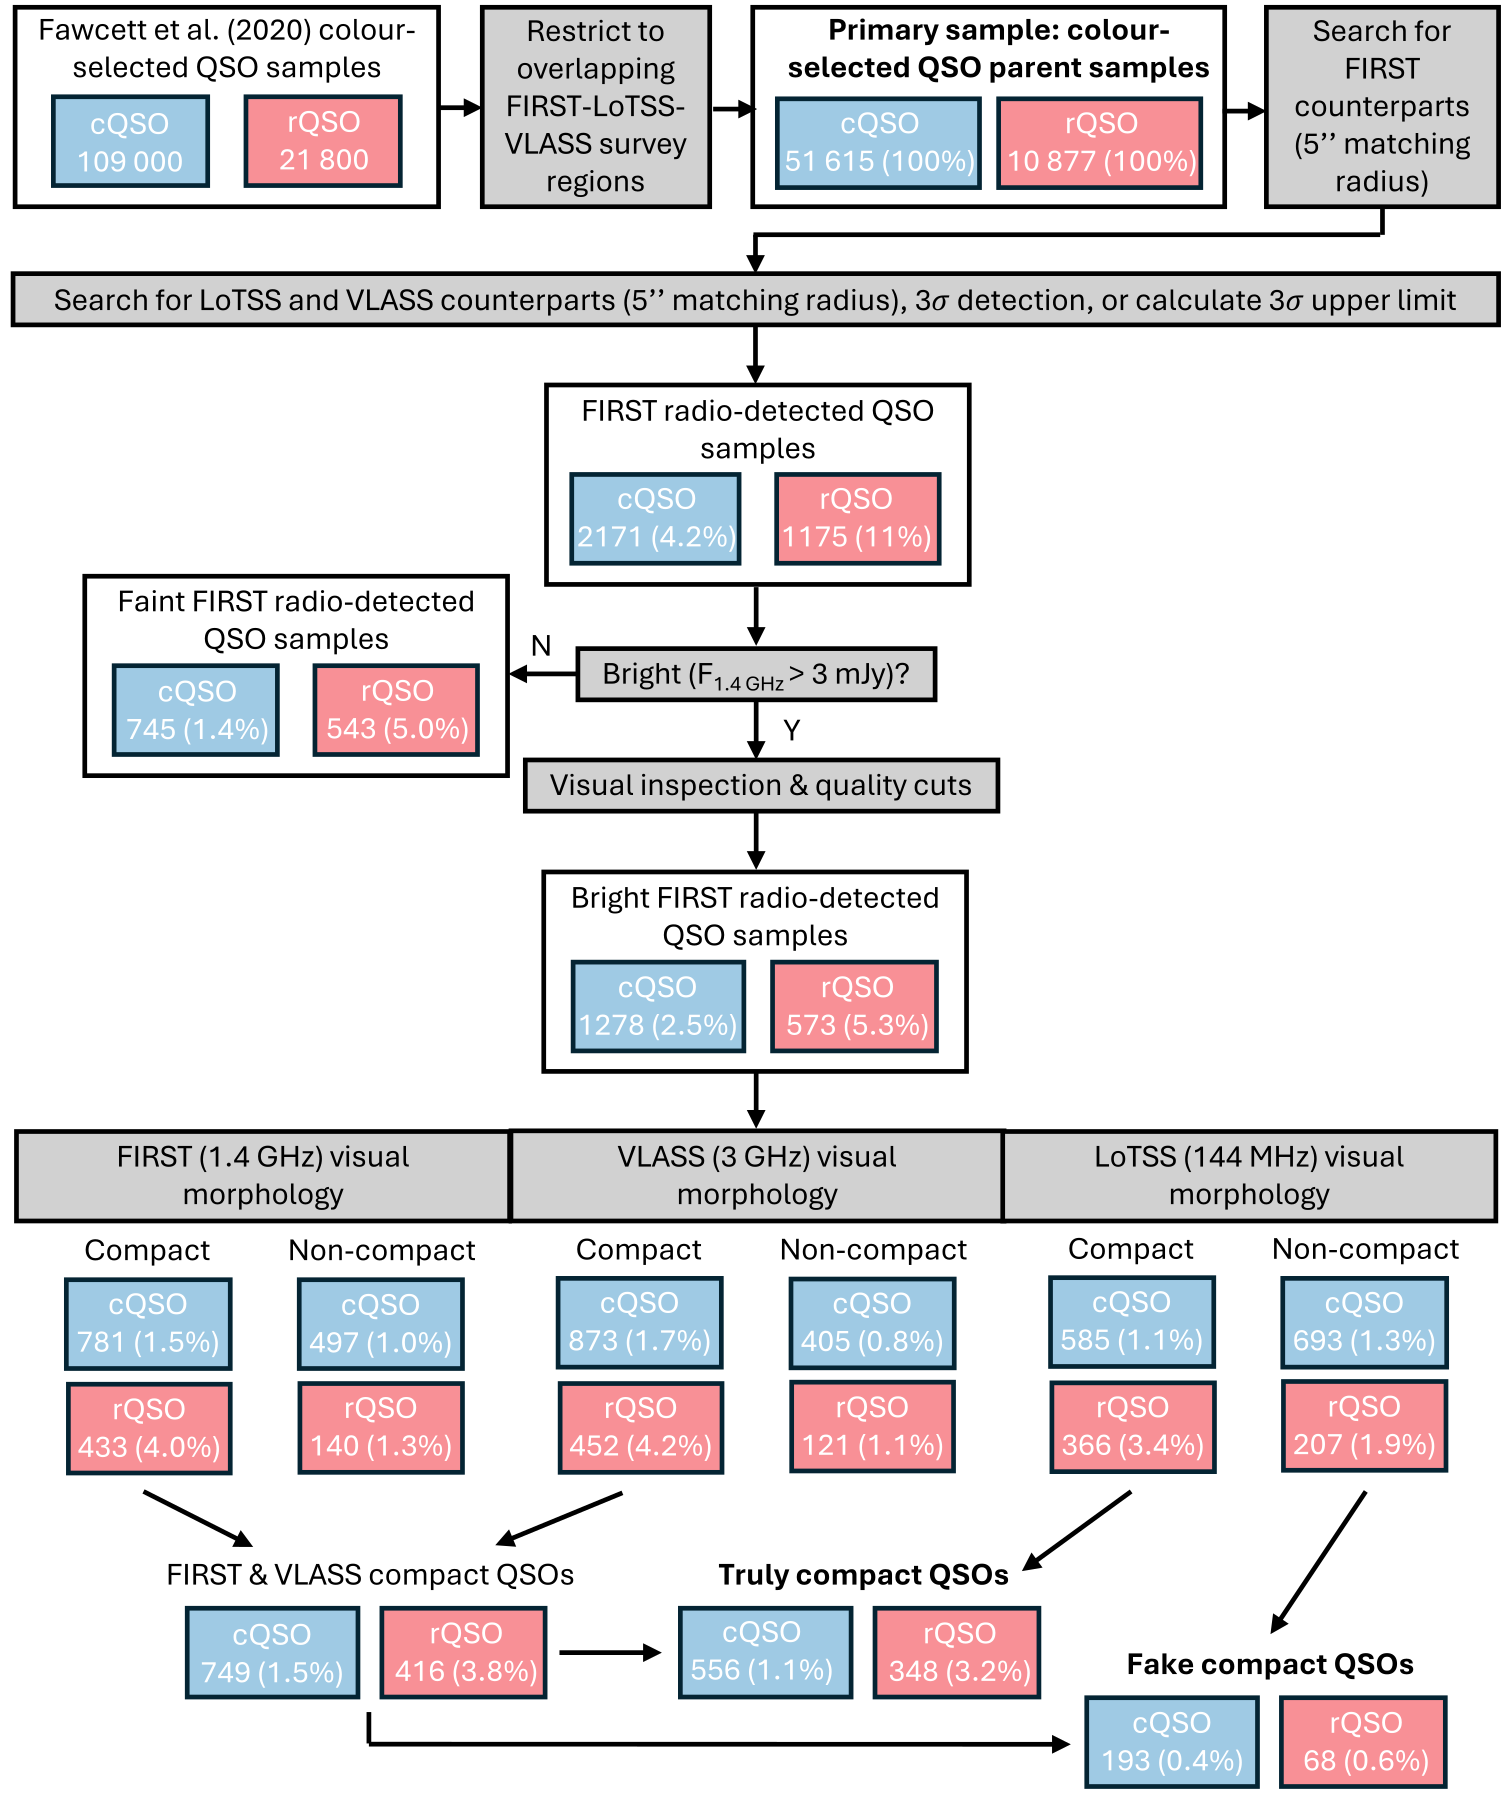
Tests the sample-construction and morphology pipeline: colour-selected quasars are matched across FIRST, LoTSS, and VLASS, then bright FIRST detections are visually divided into truly compact versus low-frequency-extended “fake compact” systems.
Original caption
Figure 2: A flowchart showing our sample selection process. We start with the colour-selected QSO samples from Fawcett et al. (2020) , and restrict them to QSOs falling within the area covered by all three radio surveys in this work (FIRST, LoTSS, VLASS), to define our colour-selected parent samples. All percentages given are relative to these parent samples. We then search for a FIRST counterpart to our QSOs within 5 ′′ of the SDSS position, and then search for VLASS and LoTSS detections also within 5 ′′ of the SDSS position, or calculate an upper limit. We then classify QSOs with a 1.4 GHz peak flux density > 3 >3 mJy as bright, and visually inspect the radio images of these bright FIRST-detected QSOs in each survey, independently classifying each as either compact or non-compact in each of the three radio surveys. A more detailed description of our visual inspection procedure is shown in Appendix B , Figure 10 . Once visually classified we group our QSOs into (1) those that are compact at low-frequency (144 MHz) and high frequency (1.4 and 3 GHz), defined as the truly compact QSOs, and (2) those that are compact at high-frequency, but non-compact at low-frequency, defined as the fake compact QSOs. These definitions are discussed further in Section 3.2 .
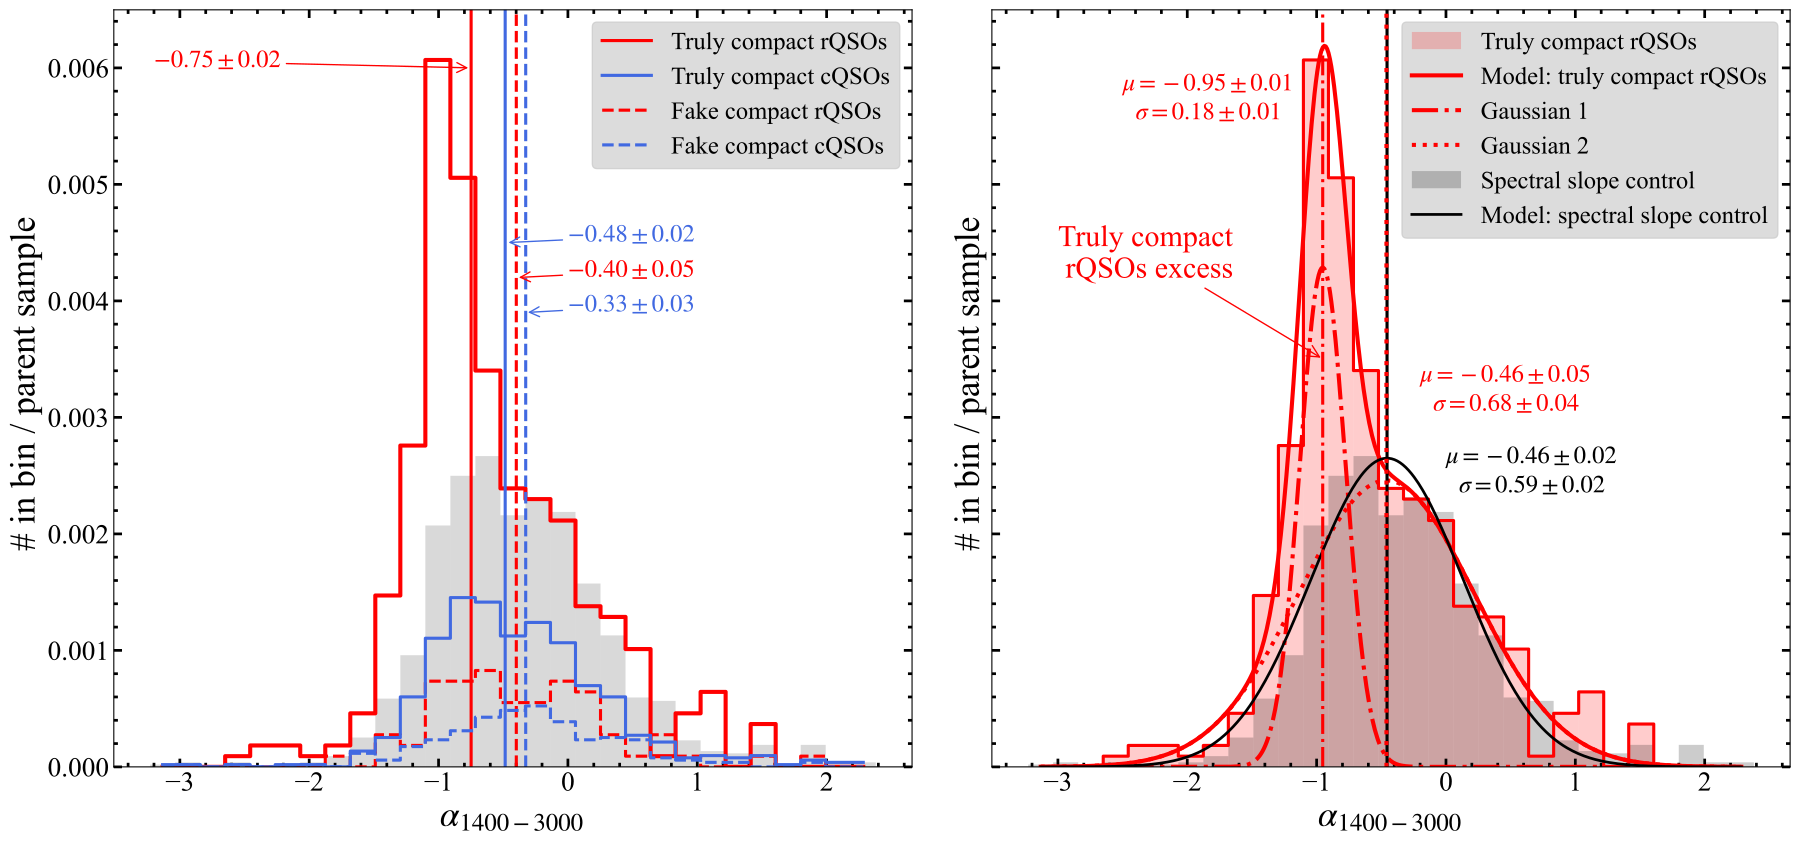
Tests whether the rQSO signal is a general shift or a distinct population by comparing normalized α1.4–3 GHz distributions and fitting a bimodal model. The caption identifies a steep excess near α≈−1 among truly compact rQSOs.
Original caption
Figure 5: Left panel : The distributions of α 1400 − 3000 \alpha_{1400-3000} for our various colour and radio morphology classifications, normalized by the size of the respective colour-selected parent sample, in order to show the relative detection rates. Red and blue lines indicate the distributions for the rQSOs and cQSOs respectively. The grey histogram is the combined distribution (sum of) all classifications other than the truly compact rQSOs (spectral slope control). The histograms and medians for the truly compact classifications are indicated by the solid lines, and the histograms and medians for the fake compact classifications are given by the dashed lines. Right panel : A bimodal distribution fit (red solid line) to the truly compact rQSOs (red histogram), with the two component Gaussians indicated by the dash-dot and dotted red lines. The black line shows the Gaussian fit to the combined distribution (grey histogram). The mean and standard deviation from each fit is indicated on the plot. The truly compact rQSOs have a strong excess of sources with steep ( α ≈ − 1 \alpha\approx-1 ) α 1400 − 3000 \alpha_{1400-3000} values over all other colour-morphology classes, as indicated by the spectral slope control distribution.
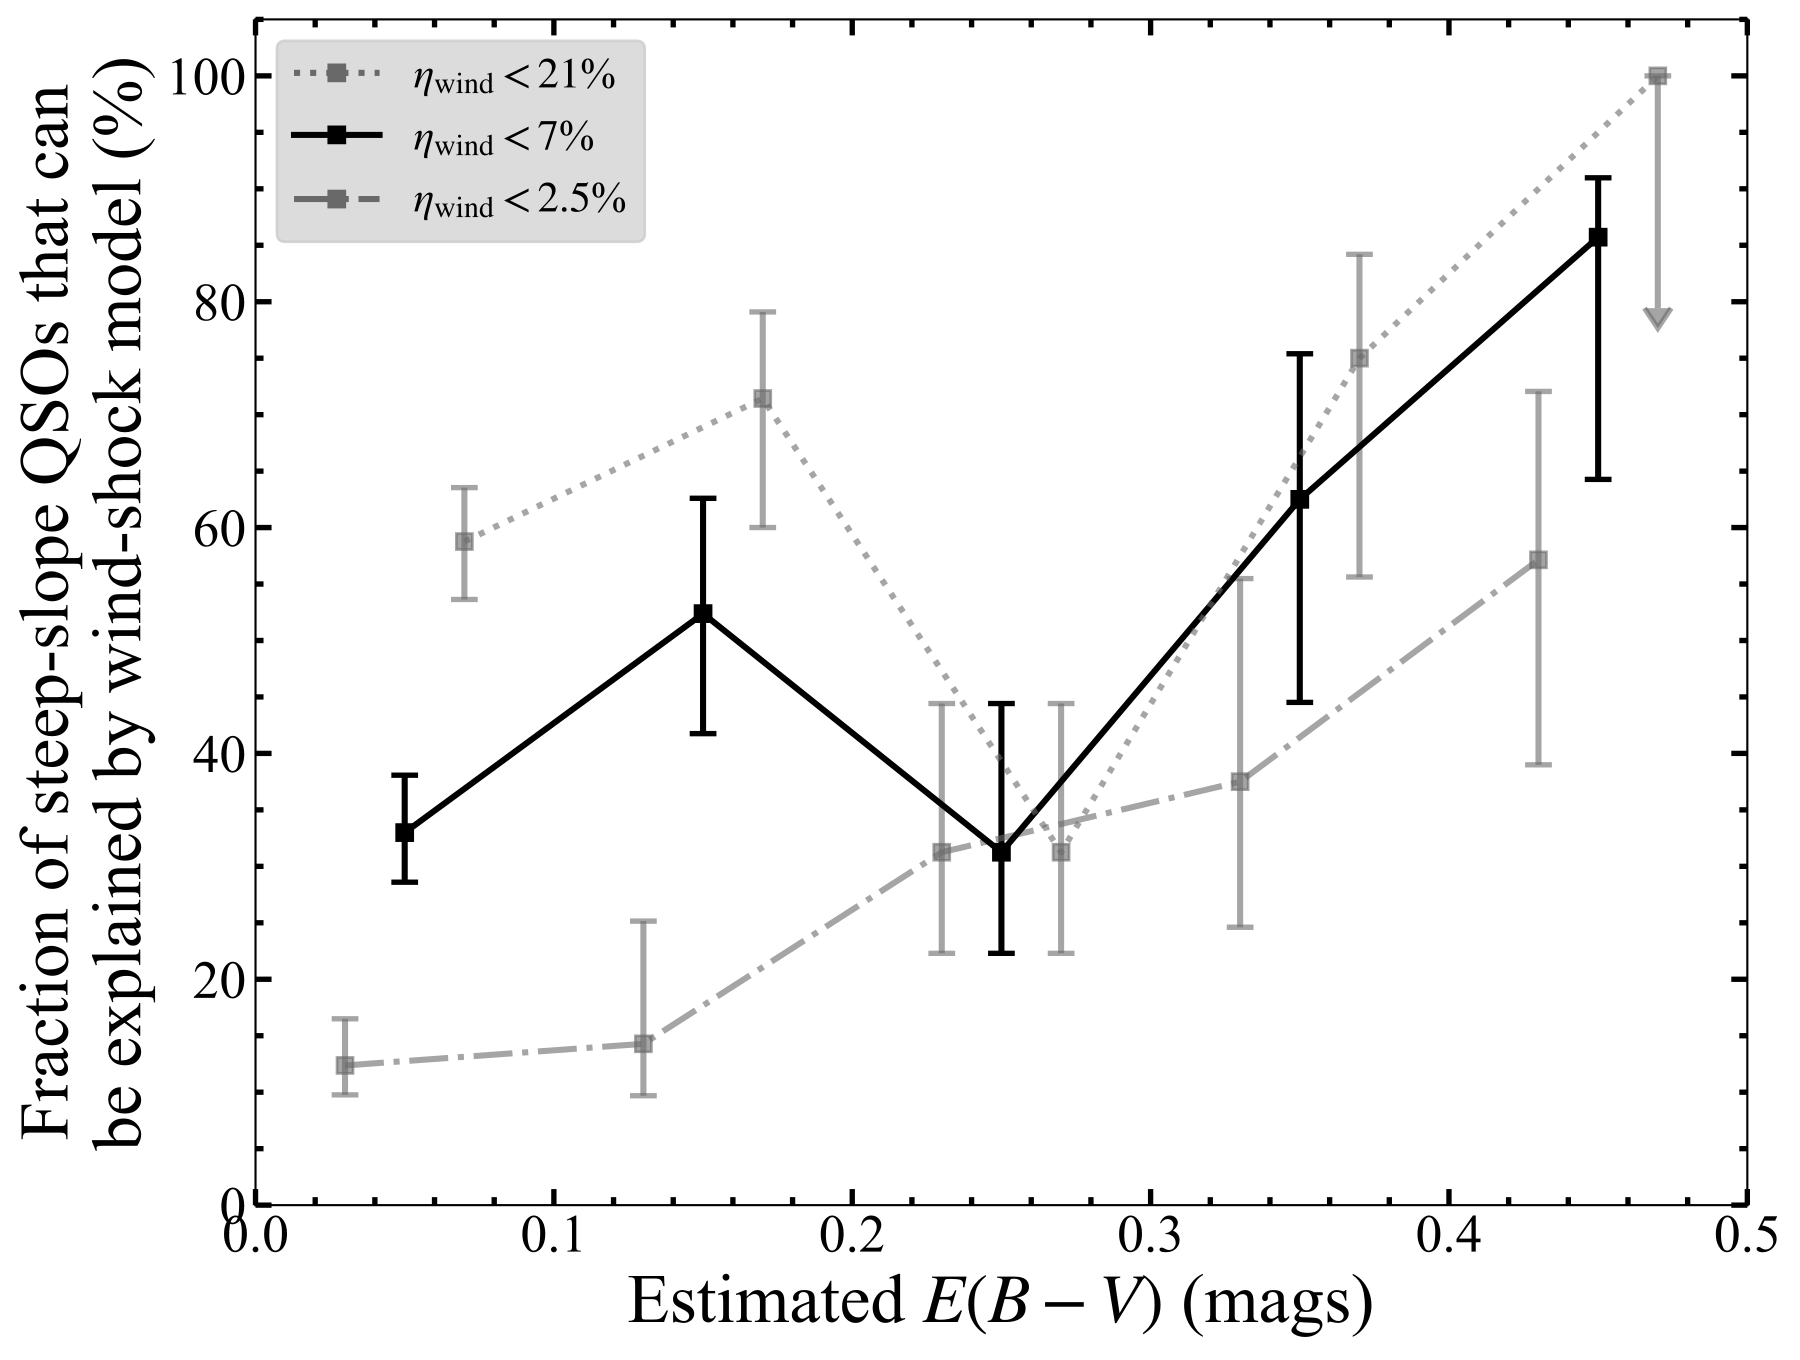
Tests model consistency rather than directly detecting shocks: it measures, by E(B−V), the fraction of steep truly compact QSOs whose radio luminosities agree with Nims et al.-style wind-shock predictions for assumed wind-efficiency thresholds.
Original caption
Figure 9: The fraction of steep 1.4 − 3 1.4-3 GHz spectral slope ( − 1.15 < α 1400-3000 < − 0.85 -1.15<\alpha_{\text{1400-3000}}<-0.85 ) truly compact QSOs with radio luminosities consistent with the prediction from the Nims et al. (2015) wind-shock model, in bins of E ( B − V ) E(B-V) , for wind efficiency values η wind < 2.5 \eta_{\text{wind}}<2.5 %, < 7 <7 % and < 21 <21 % (calculated from Equation 1 ). The number of QSOs that are consistent with this model increases with E ( B − V ) E(B-V) for any wind efficiency parameter. The 100% fraction for the < 21 <21 % wind efficiency model in the highest E ( B − V ) E(B-V) bin is given as an upper limit. The different wind efficiency points have been offset slightly in the x x -axis direction for clarity.
Related research
Previous digest
This paper argues that we select quasars from SDSS ($0.2 <z <2.4$), and use archival radio data (FIRST, VLASS, LoTSS) to visually determine the radio morphologies of 573 red quasars compared to a control sample of 1278 typical blue quasars.. The main result is that an excess of steep-slope radio emission ($α_{1.4-3\text{ GHz}}\sim-1$, where $S_ν\propto ν^α$) from red quasars with compact ($<6''$) radio morphologies over 144 MHz, 1.4 GHz, and 3 GHz.. So the paper's core point is that this agrees with the scenario where these compact red quasars are undergoing a "dusty blow-out" phase, where compact jets and/or AGN-driven winds interact with a dusty ISM, causing shocks, leading to steep spectral slopes and enhanced radio detection rates..
Sources and evidence (23)
- 2603.24739v1: A striking excess of red quasars with steep radio spectral slopes: a dusty blow-out phase revealed through AGN-driven shocks?
Red quasars exhibit a higher incidence of compact (galaxy-scale or smaller) radio emission than blue quasars, arising from systems near the radio-loud/radio-quiet threshold. In this paper we select quasars from SDSS ($0.2 <z <2.4$), and use archival radio data (FIRST, VLASS, LoTSS) to visually determine the radio morphologies of 573 red quasars compared to a control sample of 1278 typical blue quasars. We find an excess of steep-slope radio emission ($α_{1.4-3\text{ GHz}}\sim-1$, where $S_ν\propto ν^α$) from red quasars with compact ($<6''$) radio morphologies over 144 MHz, 1.4 GHz, and 3 GHz. This excess steep radio emission signature is not seen in normal blue quasars (radio compact or extended) or red quasars with extended low-frequency radio emission, which instead show a broad range of radio spectral slopes consistent with a range of different physical processes. We show that the strength of the excess steep spectral slope component increases with dust extinction, along with an overall increase in the radio-detection fraction. We argue that this excess steep-slope radio emission is due to shocks between quasar-driven winds/jets and the dusty nuclear-host galaxy environment. The majority ($86^{+5}_{-21}\%$) of the dustiest quasars ($E(B-V)>0.4$ mag) with steep slopes have radio luminosities consistent with the prediction from a wind-shock model with wind efficiencies of up to 7%. This agrees with the scenario where these compact red quasars are undergoing a "dusty blow-out" phase, where compact jets and/or AGN-driven winds interact with a dusty ISM, causing shocks, leading to steep spectral slopes and enhanced radio detection rates.
- 2603.24739v1: A striking excess of red quasars with steep radio spectral slopes: a dusty blow-out phase revealed through AGN-driven shocks?
These variations in spectral slopes arise from differences in the emission contributions and electron evolution in jet versus wind scenarios. In jets, electrons experience multiple shock encounters along the spine before reaching the jet head. As a result, the projected maps typically show flatter spectral indices near the head, where electrons retain higher energies and suffer fewer radiative losses, and steeper indices farther away toward the core. Consequently, the jet head and its nearby regions appear brighter in the stable higher-power jet, leading to a mean spectral slope of α = − 0.6 \alpha=-0.6 . In contrast, low-power, kink-unstable jets evolve less smoothly; the jet’s head is weak, and the emission in the cocoon becomes dominated by the aged electrons, leading to a steeper spectrum at low frequencies. However, the mean value measured from regions near the head ( ∼ 2 \sim 2 kpc towards the core) gives a shallower value of α = − 0.7 \alpha=-0.7 .
- 2603.24739v1: A striking excess of red quasars with steep radio spectral slopes: a dusty blow-out phase revealed through AGN-driven shocks?
Not all high frequency radio compact QSOs are compact at low frequency : A non-negligible fraction of FIRST-compact sources are extended in lower frequency LoTSS imaging (see Figure 4 & Section 3.2 ) at the same approximate spatial resolution: ∼ 17 % \sim 17\% of FIRST-compact rQSOs and ∼ 27 % \sim 27\% of FIRST-compact cQSOs are extended at the lower frequency of LoTSS, potentially indicating a higher incidence of previous radio activity in cQSOs.
- 2603.24739v1: A striking excess of red quasars with steep radio spectral slopes: a dusty blow-out phase revealed through AGN-driven shocks?
The fractions of rQSOs and cQSOs with the various flags is consistent, at 148/1426 ( 10.1 % 10.1\% ) of the cQSOS and 59/632 ( 9.3 % 9.3\% ) of the rQSOs sent for visual inspection, suggesting this approach is not biasing our morphology classification results. If an image was not flagged, this meant we were confident with the classification and it was included in the clean sample that we used for our morphology and radio spectral slope analysis, which consisted of 90% of the original sample selected for visual inspection.
- 2603.24739v1: A striking excess of red quasars with steep radio spectral slopes: a dusty blow-out phase revealed through AGN-driven shocks?
A detailed discussion of the various quality cuts that we applied, can be found in the flowchart and discussion in Appendix B , where we also show examples of visual inspection panels. We did not include sources in our final sample where the morphology classification was uncertain, for example due to another source in the image, or strong imaging artefacts. After the quality cuts, we retain 90% of the original sample selected for visual inspection, and find no difference in the fractions of rQSOs and cQSOs with various quality cut flags, with 148/1426 ( 10.1 % 10.1\% ) of the cQSOs and 59/632 ( 9.3 % 9.3\% ) of the rQSOs removed from the sample.
- 2603.24739v1: A striking excess of red quasars with steep radio spectral slopes: a dusty blow-out phase revealed through AGN-driven shocks?
We can test whether the spectral slope − E ( B − V ) -E(B-V) trend in the truly compact QSOs is due to a physical relationship between the radio emission and dust, resulting in an overall steepening of the spectral slopes, versus an overall increase in the fraction of sources in the narrow Gaussian toward dustier QSOs. In Figure 8 we have split our truly compact QSOs into bins of E ( B − V ) E(B-V) , and fit a bimodal model, made up of one narrow and one broad component, to the α 1400 − 3000 \alpha_{1400-3000} distributions in each bin. We fix the mean of the broad Gaussian at μ = − 0.46 \mu=-0.46 to be the same as that found for the spectral slope control distribution (see Figure 5 ), representative of typical FIRST & VLASS compact QSOs. The mean of the narrow Gaussian was allowed to vary, but constrained to α < 0 \alpha<0 . The standard deviation and amplitude of the broad and narrow Gaussians were all allowed to vary but constrained to be > 0 >0 to help the fitting. We find in all cases that the best-fitting solution occurs with the narrow Gaussian centred around values of α ∼ − 0.85 \alpha\sim-0.85 to α ∼ − 0.99 \alpha\sim-0.99 , with a slight preference for a steeper mean at higher E ( B − V ) E(B-V) . The uncertainties on the mean α \alpha (narrow Gaussian fit) are calculated from the covariance matrix and indicated in the figure. The fraction of sources in this narrow Gaussian increases with increasing E ( B − V ) E(B-V) , from ∼ 10 % \sim 10\% among the least dusty QSOs ( 0 ≤ E ( B − V ) < 0.1 0\leq E(B-V)<0.1 mag), up to ∼ 33 % − 35 % \sim 33\%-35\% among the dustiest QSOs in this work ( E ( B − V ) ≥ 0.2 E(B-V)\geq 0.2 mag); see Figure 8 . Thus, although the slopes generally get steeper with E ( B − V ) E(B-V) , the greatest difference is in the fraction of excess sources with steep spectral slopes with increasing E ( B − V ) E(B-V) .
- 2603.24739v1: A striking excess of red quasars with steep radio spectral slopes: a dusty blow-out phase revealed through AGN-driven shocks?
In this work, we have used samples of optically selected quasars ( 0.2 < z < 2.4 0.2<z<2.4 ) from SDSS with mid-infrared counterparts and radio counterparts in the LoTSS (144 MHz), FIRST (1.4 GHz), and VLASS (3 GHz) surveys to investigate differences in the multi-frequency radio properties of red (rQSOs) and control, i.e., typical blue QSOs (cQSOs). From a comparison of the radio morphologies and radio spectral shapes of red and blue QSOs, we have found:
- 2603.24739v1: A striking excess of red quasars with steep radio spectral slopes: a dusty blow-out phase revealed through AGN-driven shocks?
The excess radio emission from truly compact rQSOs is likely due to shocks: The truly compact rQSOs are made up of two sub-populations, one of which shows α 1400 − 3000 \alpha_{1400-3000} values typical of FIRST compact QSOs, and the other of which shows the strongest radio detection excess around steep α 1400 − 3000 \alpha_{1400-3000} values of ∼ − 1 \sim-1 (see Figure 5 & Section 3.3 ). This excess sub-population shows α 1400 − 3000 \alpha_{1400-3000} values and radio luminosities broadly consistent with the prediction from an AGN-driven wind shock model (see Section 4.2 ). The excess sub-population also shows steeper α 144 − 1400 \alpha_{144-1400} spectral slopes than the non-excess sub-population, but they are flatter (on average) than the α 1400 − 3000 \alpha_{1400-3000} slopes and this requires intermediate frequency radio observations to determine the origin.
- 2603.24739v1: A striking excess of red quasars with steep radio spectral slopes: a dusty blow-out phase revealed through AGN-driven shocks?
The contribution from the steep α 1400 − 3000 \alpha_{1400-3000} population increases with dust extinction: The increasing contribution of steep radio spectral slopes with E ( B − V ) E(B-V) suggests dustier systems are more likely to be shock-dominated (see Figures 7 - 8 & Section 3.4 ), and the connection to E ( B − V ) E(B-V) suggests a causal connection to opacity. We only observe this increasing contribution in the truly compact QSOs and not the fake compact QSOs, suggesting the excess radio emission is due to opacity on host galaxy scales or smaller.
- 2603.24739v1: A striking excess of red quasars with steep radio spectral slopes: a dusty blow-out phase revealed through AGN-driven shocks?
The radio–dust connection is only found for truly compact QSOs : Both the radio detection fraction and radio spectral slopes are correlated with E ( B − V ) E(B-V) for the truly compact QSOs, but not in QSOs with extended low frequency emission (see Figure 7 & Section 3.4 ). If the presence of extended low-frequency emission is indicative of either a more evolved QSO or a system which has had a recent earlier QSO episode, the correlation of the radio properties with dust found for only the truly compact QSOs suggests there is something unique about this potentially early (or first) phase of QSO activity.
- 2511.05029v1: Discovery of an X-ray Luminous Radio-Loud Quasar at $z=3.4$: A Possible Transitional Super-Eddington Phase
We identified ID830 as one of the most X-ray luminous radio-loud quasars discovered in the eROSITA/eFEDS field, with log L 2 − 10 keV = 45.99 \log L_{2-10\,\mathrm{keV}}=45.99 erg s -1 and a steep photon index Γ = 2.43 ± 0.21 \Gamma=2.43\pm 0.21 .
- 2511.05029v1: Discovery of an X-ray Luminous Radio-Loud Quasar at $z=3.4$: A Possible Transitional Super-Eddington Phase
The UV-based number density of ID830 corresponds to ∼ \sim 57% of the total AGN population in high luminosity range around M 1450 ≈ − 27 M_{1450}\approx-27 at z ∼ z\sim 3–4, exceeding the expected ∼ \sim 10% radio-loud fraction, suggesting that radio AGNs like ID830 may be significantly more abundant at high redshift at z ≳ 3 z\gtrsim 3 . Given their substantial radio luminosities, such sources could play a non-negligible role in AGN feedback at z ≳ 3 z\gtrsim 3 .
- 2601.02865v1: GATOS XI : Excess dust heating in the Narrow Line Regions of nearby AGN revealed with JWST/MIRI
Fig. 3 (left) shows the median SEDs across all ROIs and galaxies, separating dusty NLRs from star forming (SF) clumps. As shown in Section 3.1 , only four galaxies have resolved dust along the NLR (ESO 428 − - G14, NGC 4388, NGC 5728, NGC 3081). As a result, we restrict the NLR SEDs to these targets. Across all galaxies, we find a systematic difference between SEDs of dust in the NLR and those of SF clumps. On average, SF clumps are characterised by flatter and hotter SED distributions, while dusty NLRs produce SEDs that are steeper by a factor of two (e.g. F 18 μ m , NLR / F 10 μ m , NLR F_{18\,\rm\mu m,\,\rm NLR}/F_{10\,\rm\mu m,\,\rm NLR} = 4). While each ROI in each galaxy shows its own unique distribution, some common trends can still be identified across the sample. For example, SF clumps consistently produce higher 5.6 μ m \rm\mu m contributions (e.g. NGC 7172, NGC 3227, NGC 2992). This rise towards the shortest wavelengths may correspond to a low level of stellar light in the MIR. For dusty NLRs, a slight flux enhancement at 5.6 μ m \rm\mu m is likely due to this stellar component ( ≤ 10 % \leq 10\% ) (Rosario+ in prep) . In general, both NLR dust and SF clumps produce SEDs that peak at around at 18-21 μ m \rm\mu m . In SF clumps, a modest excess in the F1800W band over an otherwise flat SED shape could instead arise from Polycyclic Aromatic Hydrocarbon (PAH) emission ( García-Bernete et al., 2022 ) .
- 2601.02865v1: GATOS XI : Excess dust heating in the Narrow Line Regions of nearby AGN revealed with JWST/MIRI
In Haidar et al. (2024) , we discussed in detail how JWST/MIRI broadband imaging can be subject to contamination from strong emission lines, and as a result, these images may not be exclusively tracing dust emission. For example, the F1000W filter is mainly affected by contributions from the [ S iv ] λ 10.51 μ m \lambda 10.51\,\rm\mu m and H 2 H_{2} 0-0 S(2) [ 9.65 μ m 9.65\,\rm\mu m ] lines. This can make it challenging to determine the morphology and extent of the dust, potentially attributing features to dust that may, in fact, be closely linked to ionised or molecular gas instead.
- 2501.12567v1: Exploring quasar evolution with proximate molecular absorbers: Insights from the kinematics of highly ionized nitrogen
We investigate the presence and kinematics of NV absorption proximate to high redshift quasars selected upon the presence of strong $H_{2}$ and HI absorption at the quasar redshift. Our spectroscopic observations with X-shooter at the VLT reveal a 70% detection rate of NV (9 of 13 quasars with 2.5 < z < 3.3), remarkably higher than the 10% detection rate in intervening DLA systems and the 30% rate observed within a few thousand km/s of the source in the general quasar population. While many NV components lie within the velocity range of the neutral gas, the kinematic profiles of high-ionization species appear decoupled from those of low-ionization species, with the former extending over much larger velocity ranges, particularly towards bluer velocities. We also observe significant variations in the NV/SiIV, which we attribute to varying ionization conditions, with a velocity-dependent trend: blueshifted NV components systematically exhibit higher ionization parameters compared to those near the quasar's systemic redshift. Furthermore, the most redshifted systems relative to the quasar show no evidence of NV absorption. The results suggest that proximate $H_{2}$ absorption systems select critical stages of quasar evolution, during which the quasar remains embedded in a rich molecular environment. Redshifted systems trace infalling gas, potentially associated with mergers, preceding the onset of outflows. Such outflows may reach or even carry out neutral and molecular gas.This latter stage would correspond to proximate $H_{2}$ systems located around or blueshifted relative to the quasar's systemic z. Finally, the only case in our sample featuring highly blueshifted neutral gas shows no evidence of an association with the quasar.Our findings highlight the need to account for the ionization state when defining a velocity threshold to distinguish quasar-associated systems from intervening.
- 2506.18112v1: Peering into the heart of darkness with VLBA : Radio Quiet AGN in the JWST North Ecliptic Pole Time-Domain Field
We present initial results from the 4.8 GHz Very Long Baseline Array (VLBA) survey of the JWST North Ecliptic Pole Time-Domain Field (TDF). From 106 radio sources found in the Karl G. Jansky Very Large Array observations in the TDF, we detected 12 sources ( ∼ \sim 11% detection rate) at ∼ 3.3 μ \sim 3.3\,\mu Jy rms sensitivity and ∼ \sim 4 mas resolution. Most detections exhibit pc-scale emission (less than 40 pc) with high VLBA/VLA flux density ratios and brightness temperatures exceeding 10 5 10^{5} K, confirming non-thermal AGN activity. Spectral indices α ≳ − 0.5 \alpha\gtrsim-0.5 correlate with higher VLBA/VLA flux ratios, consistent with synchrotron emission from AGN coronae or jets. In the majority of our sources star formation contributes less than 50% of the total VLBA radio emission, with a few cases where the emission is almost entirely AGN-driven. Although the radio emission from radio quiet AGN is thought to be primarily driven by star formation, our VLBA observations confirm that there is also often a contribution at various levels from black hole driven AGN. Eight VLBA detections have JWST/NIRCam counterparts, predominantly early-type, bulge-dominated galaxies, which we use to get an estimate of the redshift and star formation rate (SFR). WISE colors indicate that VLBA detections are either AGN or intermediate-disk-dominated systems, while VLBA non-detections correspond to extended, star-forming galaxies. We compare SFRs derived from previous SCUBA-2 850 μ \mu m observations with new JWST-based estimates, and discuss the observed discrepancies, highlighting JWST’s improved capability to disentangle AGN activity from star formation.
- 2506.18112v1: Peering into the heart of darkness with VLBA : Radio Quiet AGN in the JWST North Ecliptic Pole Time-Domain Field
The survey detected 12 of 106 known radio sources, with a detection rate of ∼ \sim 11 % \% , and achieved a mas resolution suitable for pinpointing compact AGN emissions primarily concentrated within the central parsec-scale regions. For sources with S(3 GHz) brighter than 50 μ \mu Jy, the detection rate increases to ∼ \sim 35%. By design, this study probes AGN that are intrinsically radio-faint. This could correspond to either luminous, distant sources or faint, nearby ones. The radio luminosities of sources with known redshifts are 0.2 − 16.7 × 10 23 0.2-16.7\times 10^{23} W Hz -1 , consistent with the characteristics of low-excitation radio AGN. For most of these galaxies, the radio emission is unresolved and confined to the central < < 40 pc, suggesting an origin closely linked to the AGN. This compact radio emission likely traces the base of the jet, that is, the region where the jet is launched, which may coincide spatially with the accretion-disk corona. The radio emission is likely either optically thin synchrotron radiation from an outflow originating near the center or synchrotron self-absorbed emission from an optically thick region.
- 2507.01355v1: The birth of young radio jets in changing-look AGN: a population study
In order to determine how well we can rule out radio flares associated with changing-look events for the objects in our sample, we consider the radio variability properties of 1ES 1927+654, Mrk 590, and NGC 1566 and whether similar events would be detectable for the other sources given their redshifts and the VAST single-epoch sensitivity of 1-2 mJy. 1ES 1927+654, at redshift z = 0.017 z=0.017 and with BH mass of ∼ 10 6 M ⊙ \sim 10^{6}M_{\odot} , exhibited an increase in 5 GHz radio luminosity from log L 5 GHz = 37.7 \log L_{5\text{GHz}}=37.7 erg s -1 to log L 5 GHz = 39.0 \log L_{5\text{GHz}}=39.0 erg s -1 over 1 year, with this rebrightening taking place 5 years after an optical outburst associated with the temporary appearance of broad lines [ 38 ] . Mrk 590, at redshift z = 0.026 z=0.026 and with BH mass of ∼ 10 8 M ⊙ \sim 10^{8}M_{\odot} , varied from a 5 GHz radio luminosity from log L 5 GHz = 38.25 \log L_{5\text{GHz}}=38.25 erg s -1 in 1995 to log L 5 GHz = 37.65 \log L_{5\text{GHz}}=37.65 erg s -1 in 2014 while its broad lines disappeared between 2003/2006 and 2013, with prior fading observed since 1989 [ 10 ] . NGC 1566, at redshift z = 0.005 z=0.005 and with BH mass of ∼ 10 7 M ⊙ \sim 10^{7}M_{\odot} , varied from a 887.5 MHz radio luminosity from log L 887 MHz = \log L_{887\text{MHz}}= 36.83 to 36.70 erg s -1 while transitioning from a type 1 to 2 state. With our VAST light curves, we observe the tail-end of this trend of radio fading for Mrk 590 and NGC 1566 in 887.5 MHz. We conclude that for the 14 CLAGN with z > > 0.05, we would not actually detect Mrk 590-like luminosities, since they are too faint to see with the VAST 2 mJy limit. The log 10 \log_{10} mass of Mrk 590 is 8.29 and the log 10 \log_{10} masses of the 14 other z > > 0.05 VAST-detected CLAGN lie in the range of 7.40 to 9.32. For the 6 other z < < 0.05 VAST-detected CLAGN, we can rule out a Mrk 590-like flare but not an NGC 1566-like flare. Additionally, 11 of our CLAGN objects are much more radio luminous and radio loud than Mrk 590 and NGC 1566.
- 2507.01355v1: The birth of young radio jets in changing-look AGN: a population study
Our population study of CLAGN was motivated by individual CLAGN that were well studied in multiple wavelengths. The interesting behavior seen in these CLAGN prompted us to pose three main questions in Section I about the properties of CLAGN at a population level. We found that the vast majority of our CLAGN sample were radio point sources and more than half of our sample were radio-loud, with a fraction of roughly 21 % 21\% of the sample having high radio loudness ratios ( R > 100 R>100 ). This implies that CLAGN radio emission is coming from the base of the compact jet close to the SMBH (rather than the X-ray emitting corona) for these objects. Through our multi-wavelength population study of 474 optically and spectroscopically-selected CLAGN, and comparing this sample to a RQ to RL AGN and to a control AGN sample, we present our answers to the three questions presented in the Introduction.
- 2508.21678v1: Investigating Little Red Dots with UV Excess: Are They the High-Redshift Siblings of Blue Hot DOGs?
A key selection criterion for LRDs is their compact morphology, which distinguishes them from populations like Hot DOGs that are selected purely by color. This results in a significant size difference: LRDs have a median effective radius of R e ∼ 100 R_{e}\sim 100 pc [ 1 , 32 ] , while Hot DOGs are much more extended with R e ∼ 1 R_{e}\sim 1 – 4 4 kpc [ 17 , 13 ] . The morphology of these objects can provide clues to the host galaxy’s contribution to their blue emission. While obscured star formation was considered as a possible way to explain the extended UV emission in BHDs [ 6 ] , high polarization seen in BHDs confirms that the extended UV emission is instead due to light scattered from an outflow [ 8 ] . In contrast, for some LRDs, exhibiting a resolved UV morphology is evidence of a contributing host galaxy [ 57 , 69 , 11 ] .
- 2508.21678v1: Investigating Little Red Dots with UV Excess: Are They the High-Redshift Siblings of Blue Hot DOGs?
A similar conclusion is reached in some other works. For example, the high similarity in the elevated red side of “V-shape” SEDs commonly seen in LRDs suggests that the model of a reddened AGN with partial scattered emission cannot explain the observed SEDs of LRDs well ( Setton et al. 61 ; Labbé et al. 34 ). In addition, the lack of significant photometric variability in the 21 “V-shape” LRDs from Tee et al. [65] implies an upper limit of ∼ \sim 30% for the total observed UV light attributed to the AGN contribution. At rest-frame optical wavelengths, the unresolved morphology suggests an AGN’s dominance in LRDs. However, at shorter wavelengths, approximately 30% of LRDs exhibit resolved UV morphologies [ 69 , 57 , 11 ] suggesting that the rest-frame UV continuum could be primarily contributed by host galaxies in LRDs.
- 2601.17416v1: The rest ultraviolet to infrared spectral energy distributions of heavily reddened quasars are "V-shaped" and hot-dust poor
We present a rest-ultraviolet to infrared spectral energy distribution (SED) analysis of 63 heavily reddened quasars (HRQs) at redshifts z=0.7-2.7 and with dust extinctions E(B-V)=0.4-1.8. Our analysis demonstrates that SEDs with red optical and blue UV continua are very common in HRQs, with more than 82 per cent of the sample showing a UV-excess relative to the reddened quasar continuum. We model the SEDs by combining a reddened quasar and an unobscured scattered light component, though contributions from a star-forming host galaxy cannot be ruled out. The average scattering fraction is small (0.3 per cent). Higher scattering fractions are ruled out by the (i-K)=2.5 colour-cut used to select HRQs which pre-dates the discovery of the JWST "Little Red Dot" (LRD) population. Hence, LRDs generally have bluer UV continua. Nevertheless, four HRQs satisfy the LRD UV/optical continuum slope selections and are therefore massive, cosmic noon analogues of LRDs. Analysis of the near-infrared SEDs of HRQs reveals a deficit of hot dust relative to blue quasars, similar to what is observed in LRDs. This suggests HRQs trace a phase where strong AGN feedback processes eject dust from the inner torus. The UV scattering fraction of HRQs is weakly correlated with the amount of hot dust emission and anti-correlated with the line-of-sight extinction, E(B-V). This is consistent with the hot dust acting as the scattering medium, and the line-of-sight extinction being dominated by dust on interstellar medium scales in the host galaxy.
- 2509.03291v1: What Do Radio Emission Constraints Tell Us About Little Red Dots as Tidal Disruption Events?
The real nature of little red dots (LRDs), a class of very compact galaxies in the early Universe recently discovered by the James Webb Space Telescope, is still poorly understood. The most popular theories competing to interpret the phenomena include active galactic nuclei and enhanced star formation in dusty galaxies. To date, however, neither model gives a completely satisfactory explanation to the population as a whole; thus, alternative theories have arisen, including tidal disruption events (TDEs). By considering observational constraints on the radio emission of LRDs, we discuss whether TDEs are adequate alternatives solving these high-redshift enigmas. We utilise radio flux density upper limits from LRD stacking analyses, TDE peak radio luminosities, and volumetric density estimates. We find that the characteristic values of flux densities and luminosities allow radio-quiet TDEs as the underlying process of LRDs in any case, while the less common radio-loud TDEs are compatible with the model under special constraints only. Considering other factors, such as volumetric density estimates, delayed and long-term radio flares of TDEs, and cosmological time dilation, TDEs appear to be a plausible explanation for LRDs from the radio point of view.
Abstract
Red quasars exhibit a higher incidence of compact (galaxy-scale or smaller) radio emission than blue quasars, arising from systems near the radio-loud/radio-quiet threshold. In this paper we select quasars from SDSS ($0.2 <z <2.4$), and use archival radio data (FIRST, VLASS, LoTSS) to visually determine the radio morphologies of 573 red quasars compared to a control sample of 1278 typical blue quasars. We find an excess of steep-slope radio emission ($α_{1.4-3\text{ GHz}}\sim-1$, where $S_ν\propto ν^α$) from red quasars with compact ($<6''$) radio morphologies over 144 MHz, 1.4 GHz, and 3 GHz. This excess steep radio emission signature is not seen in normal blue quasars (radio compact or extended) or red quasars with extended low-frequency radio emission, which instead show a broad range of radio spectral slopes consistent with a range of different physical processes. We show that the strength of the excess steep spectral slope component increases with dust extinction, along with an overall increase in the radio-detection fraction. We argue that this excess steep-slope radio emission is due to shocks between quasar-driven winds/jets and the dusty nuclear-host galaxy environment. The majority ($86^{+5}_{-21}\%$) of the dustiest quasars ($E(B-V)>0.4$ mag) with steep slopes have radio luminosities consistent with the prediction from a wind-shock model with wind efficiencies of up to 7%. This agrees with the scenario where these compact red quasars are undergoing a "dusty blow-out" phase, where compact jets and/or AGN-driven winds interact with a dusty ISM, causing shocks, leading to steep spectral slopes and enhanced radio detection rates.
Discussion
Discussion access requires a security token. Register for the weekly digest.