2610.19317v1 · First listed 2026-10-15
Deep X-ray View of a Distant Protocluster Anchored by a Quasar at $z=6.63$: No Evidence for Enhanced X-ray AGN Activity
In 865 ks of Chandra imaging, no X-ray AGN is detected among 21 confirmed non-quasar members of the z=6.63 J0910−0414 protocluster. The resulting limits do not establish environmental enhancement, but still allow substantial excess activity. [1][3][5]
Evidence
The authors analyze ∼865 ks of Chandra data and build a 251-source catalog. Candidate sources were found with wavdetect in 0.5–7, 0.5–2, and 2–7 keV images, then retained when the binomial no-source probability was PB<0.01 in at least one band. Among 21 spectroscopically confirmed protocluster galaxies, excluding the central quasar, none is individually detected. Individual 90% limits are L2–10 keV≲(2–13)×10^43 erg s−1. Aperture photometry and stacking used source-masked images, additionally masking other targets; the all-member stack has ∼17 Ms total exposure and no significant signal, giving ⟨L2–10 keV⟩≤9.54×10^42 erg s−1. The zero-detection result gives fAGN<0.09 at the upper edge of the central 90% Jeffreys interval. [1][7][8][3][4]
Earlier work
For a partial comparison with earlier dedicated Chandra protocluster studies, the authors impose log(LX/erg s−1)=43.8: 18 J0910−0414 members are sufficiently sensitive, yielding fAGN<0.10, whereas reclassified published fractions span 0.02–0.25. This does not demonstrate that J0910−0414 is lower than those systems: member selection and sensitivity differ, and the paper describes the comparison as only partial. Its field baseline is instead a Compton-thin X-ray luminosity function (XLF), spatially folded through the survey sensitivity: Nexp,field=0.0356. Scaling that expectation by the measured galaxy overdensity gives Nexp=0.131. [4][1]
What changes
The authors characterize this as the first systematic X-ray AGN census of member galaxies in a z>6 protocluster. Rather than interpreting a null detection solely as a low AGN fraction, they normalize the field XLF prediction by the observed galaxy overdensity and limit any further enhancement of detectable, Compton-thin AGN to ηrel<17.5 (one-sided 90%). Thus the measurement finds no significant excess, but is not yet restrictive enough to exclude an order-of-magnitude-scale environmental enhancement. [1][5]
Limits and open questions
These are limits on X-ray-detectable Compton-thin AGN, not total black-hole accretion. Heavily obscured, intrinsically X-ray-weak, or intermittent AGN can evade the survey. The XLF is extrapolated beyond its calibrated redshift range, while the overdensity correction assumes Lyα emitters trace potential X-ray-AGN hosts and applies a profile measured over a narrower velocity interval than the adopted Δz=0.2 volume. The predominantly emission-line-selected membership may also miss dusty galaxies. Indeed, a separate z=6.6 study finds NIRCam-dark, ALMA-detected starbursts, illustrating that such populations can be missed by UV/near-IR selection, though it does not measure J0910−0414 AGN incidence. [1][9][23]
The supplied record includes the abstract, selected HTML extraction blocks, and figure captions, but not the full member table, stacking-count calculation, or detailed XLF integration; individual-source and host-property inferences are therefore limited to the reported summary values.
Key figures
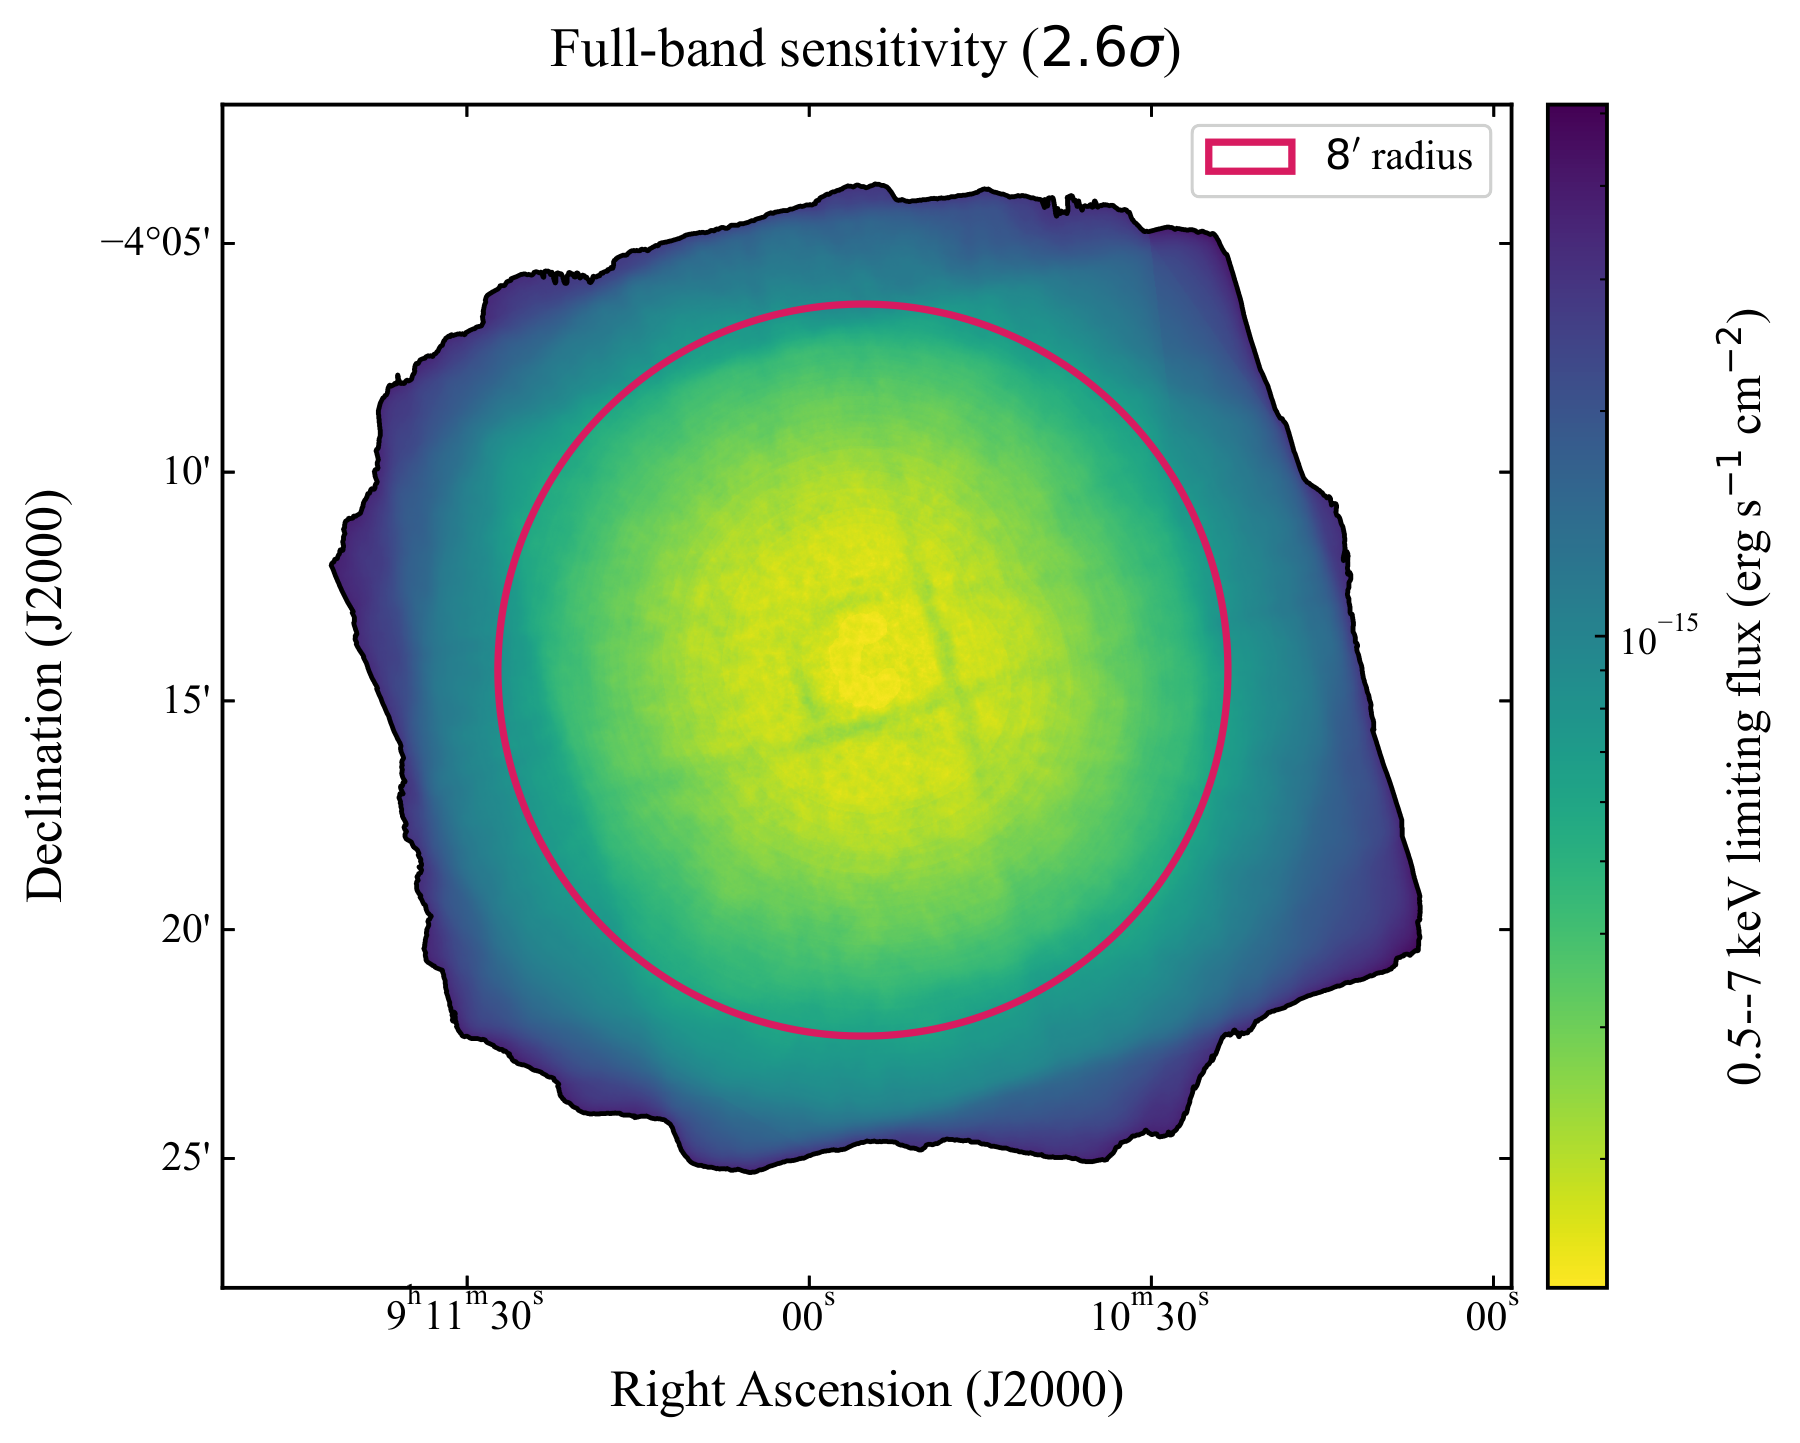
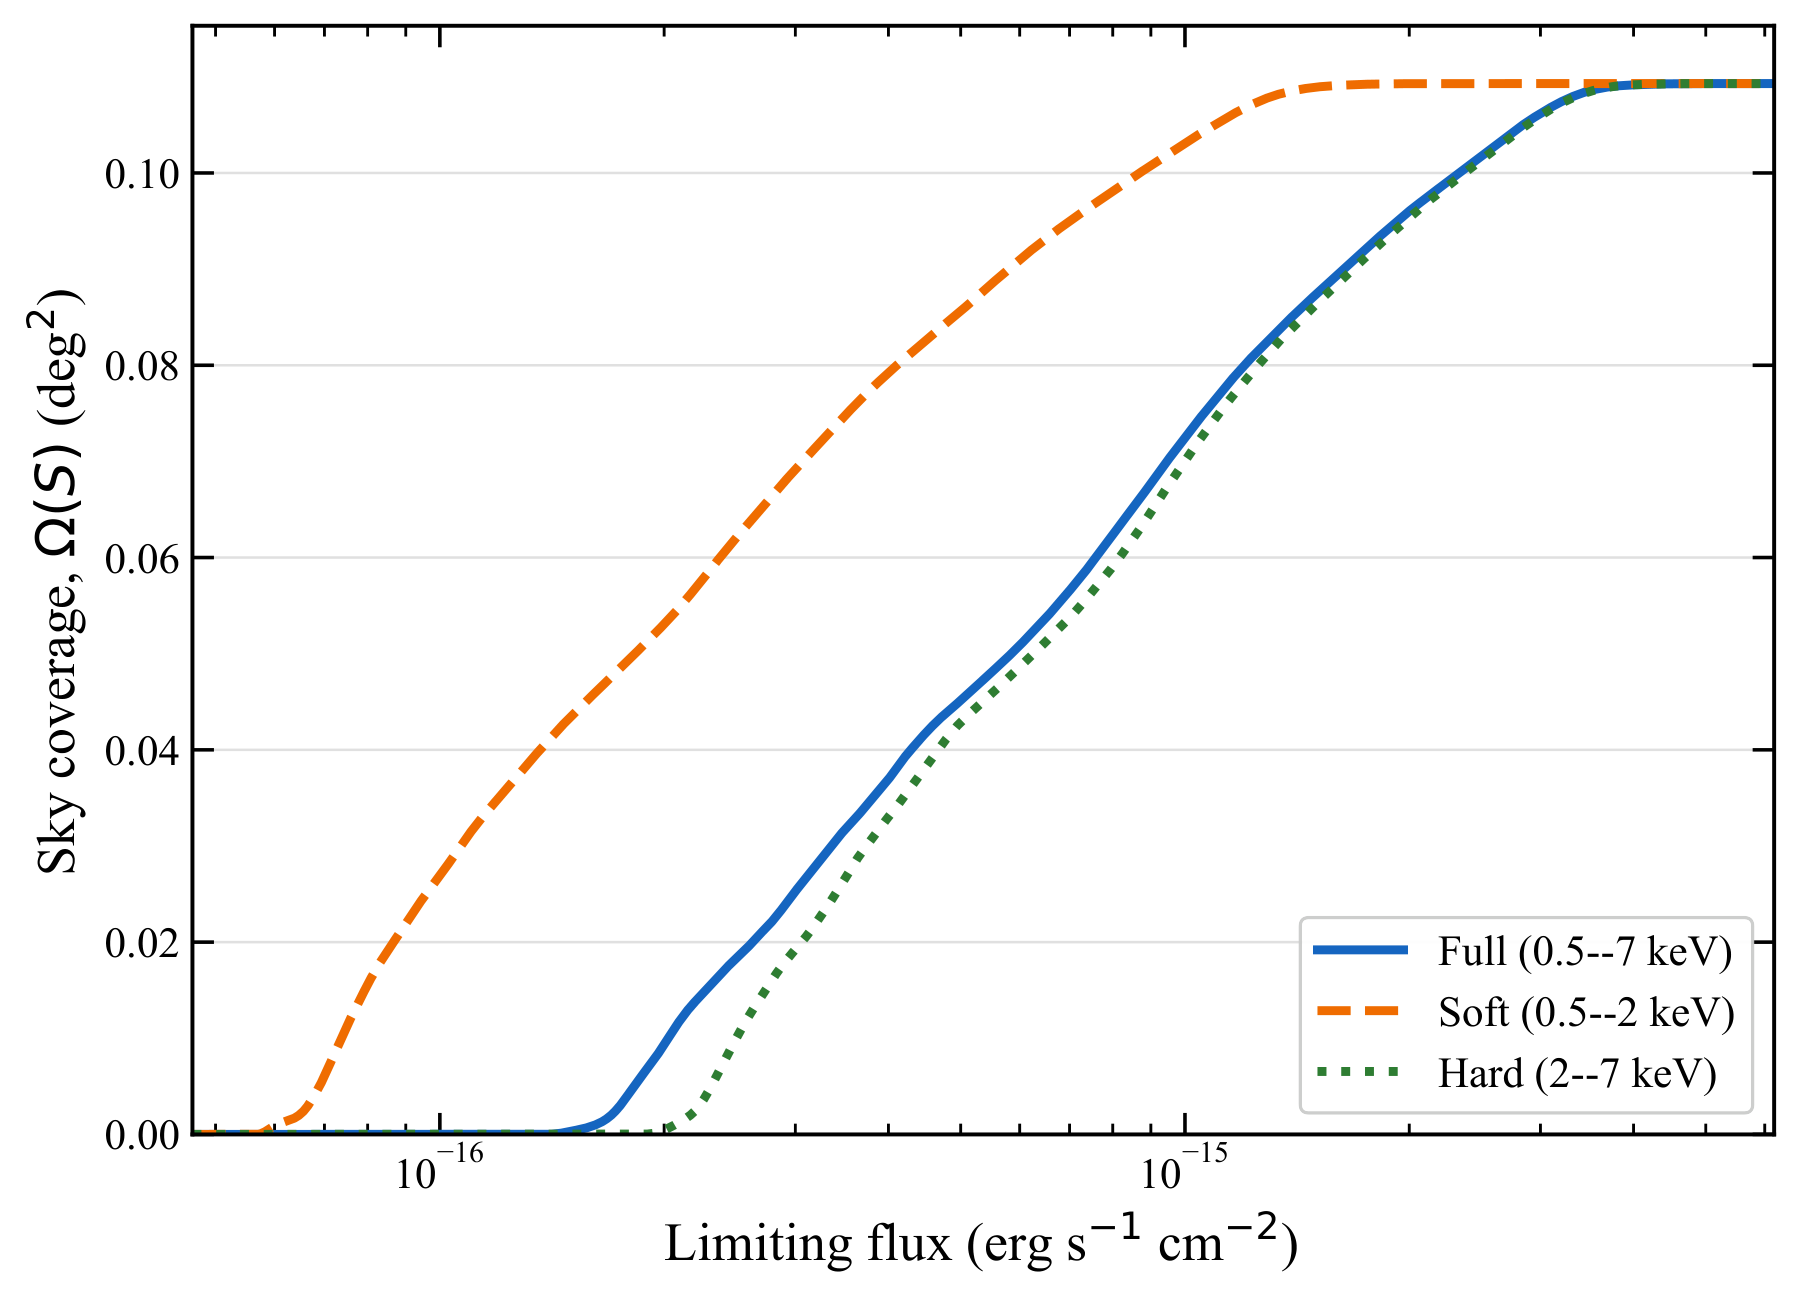
Tests the spatially varying full-band flux sensitivity and sky coverage that must be incorporated when turning zero companion detections into AGN constraints.
Original caption
Figure 3: Left: Full-band sensitivity map. The color bar gives the 0.5–7 keV flux corresponding to the adopted 2.6 σ \sigma lim_sens threshold. The black contour traces the common exposure footprint, and the magenta circle marks the 8 ′ 8\arcmin -radius region used for the protocluster analysis. Right: Sky coverage in the full (blue solid), soft (orange dashed), and hard (green dotted) bands.

Places the J0910−0414 90% upper bound on X-ray AGN fraction beside published protocluster values. It is descriptive rather than a matched comparison because selections and sensitivities differ.
Original caption
Figure 6: X-ray AGN fraction as a function of redshift for protoclusters with dedicated Chandra observations. Each protocluster is plotted with a distinct marker symbol (see legend). Open symbols denote the published SMG/DSFG-only fractions for ZFIRE and Hyperion [ 56 ] , SSA22 [ 115 , 113 , 65 ] , and DRC [ 116 ] . All other protocluster fractions use the broader member samples defined in the cited studies. The red downward triangle marks the upper boundary of the central 90% Jeffreys credible interval for J0910 − - 0414 at z = 6.63 z=6.63 ; error bars for the detected fractions show central 68% Jeffreys credible intervals. The shaded bands at low redshift show the cluster X-ray AGN fractions from Martini et al. [79] and Bufanda et al. [20] . The plotted points show the published fractions before applying a common X-ray luminosity threshold; the partial fixed-threshold comparison is described in the text. Because the member selections and X-ray sensitivities differ among structures, the figure provides descriptive context rather than a matched quantitative comparison.

Tests the null result against field-XLF expectations after the sensitivity map and, separately, the galaxy-overdensity scaling are applied; it shows 0.0356 and 0.131 expected AGN, respectively.
Original caption
Figure 7: (a) Compton-thin XLF at z = 6.63 z=6.63 from the adopted model of Pouliasis et al. [95] . The blue band includes the uncertainties in the XLF parameters. (b) Expected number of X-ray AGN in the 8 ′ 8\arcmin -radius aperture and a redshift slice of width Δ z = 0.2 \Delta z=0.2 , after accounting for the spatially varying 2.6 σ \sigma sensitivity. Solid and dashed curves distinguish the calibrated ( 3 ≤ z ≤ 6 3\leq z\leq 6 ) and extrapolated ( z > 6 z>6 ) field-XLF regimes. The blue star marks the field expectation, N exp , field = 0.0356 N_{\rm exp,field}=0.0356 , at z = 6.63 z=6.63 , and its error bar includes the same uncertainties. The orange diamond marks the overdensity-scaled expectation, N exp , OD = 0.131 N_{\rm exp,OD}=0.131 , and its error bar additionally includes the uncertainty in the galaxy overdensity. The red downward triangle marks the 90% upper limit from zero detected companions, and the pink shaded region indicates the adopted protocluster redshift interval.
Related research
Previous digest
Using an ultra-deep 865 ks Chandra campaign, Wang et al. conduct the first systematic X-ray AGN census of the z=6.63 J0910-0414 quasar protocluster, cataloging 251 X-ray sources and testing 21 spectroscopically confirmed member galaxies apart from the central quasar. None is individually detected, and a roughly 17 Ms stacked exposure likewise yields no signal, limiting the mean rest-frame 2–10 keV luminosity to ≤9.54×10^42 erg s^-1 and the central 90% AGN-fraction upper bound to f_AGN<0.09. Sensitivity-folded X-ray luminosity-function calculations predict only 0.0356 field AGN, or 0.131 after scaling by the measured galaxy overdensity; the resulting η_rel<17.5 limit finds no significant excess of X-ray-detectable accretion beyond the overdensity itself. This directly tests whether an extreme reionization-era quasar environment accelerates observable SMBH growth, while still allowing heavily obscured, X-ray-weak, or intermittent AGN among its galaxies.
Sources and evidence (25)
- 2610.19317v1: Deep X-ray View of a Distant Protocluster Anchored by a Quasar at $z=6.63$: No Evidence for Enhanced X-ray AGN Activity
Whether dense environments accelerate SMBH growth during cosmic reionization remains uncertain because X-ray constraints on $z>6$ protoclusters are rare. We analyze $\sim865$ ks of Chandra observations of J0910-0414 quasar field, a massive protocluster at $z=6.63$. We construct a catalog of 251 X-ray sources and search for AGN among 21 spectroscopically confirmed members, excluding the central quasar. This is the first systematic X-ray AGN census in a $z>6$ protocluster; none of the members is individually detected. Stacking all members ($\sim17$ Ms total exposure) yields no significant signal and limits the average rest-frame 2-10 keV luminosity to $\langle L_{\rm 2-10~keV}\rangle\leq9.54\times10^{42}~\rm erg~s^{-1}$. The null result gives a central 90% Jeffreys upper bound of $f_{\rm AGN}<0.09$. After accounting for the spatially varying sensitivity, the field Compton-thin X-ray luminosity function predicts $N_{\rm exp,field}=0.0356$ AGN in the surveyed volume. Assuming the overdensity profile of AGNs in this protocluster is the same as that of galaxies determined by Wang et al. (2024), the expected AGN count becomes $N_{\rm exp}=0.131$. Zero detections then imply a one-sided 90% upper limit of $η_{\rm rel}<17.5$ on any additional X-ray AGN enhancement beyond that associated with the galaxy overdensity. Although $η_{\rm rel}<17.5$ permits more than an order-of-magnitude enhancement, the data show no significant excess of X-ray-detectable AGN in J0910-0414 protocluster. The present X-ray data may miss heavily obscured, intrinsically X-ray-weak, or intermittently accreting SMBHs; the non-detection therefore does not rule out AGNs among the member galaxies.
- 2610.19317v1: Deep X-ray View of a Distant Protocluster Anchored by a Quasar at $z=6.63$: No Evidence for Enhanced X-ray AGN Activity
We constructed a catalog of 251 sources detected in at least one of the full (0.5–7 keV), soft (0.5–2 keV), and hard (2–7 keV) bands; 247 are detected in the full band. The minimum 2.6 σ \sigma full-band flux limit is 1.34 × 10 − 16 erg s − 1 cm − 2 1.34\times 10^{-16}~\mathrm{erg~s^{-1}~cm^{-2}} . We identified secure multiwavelength counterparts for 227 sources (90.4%) and plausible counterparts for a further 20 (8.0%). The cumulative number counts are broadly consistent with the empirical broken-power-law relation of Georgakakis et al. [45] and measurements from other deep fields. See Section II .
- 2610.19317v1: Deep X-ray View of a Distant Protocluster Anchored by a Quasar at $z=6.63$: No Evidence for Enhanced X-ray AGN Activity
None of the 21 spectroscopically confirmed galaxies in the adopted protocluster redshift interval is individually detected in X-rays; their 90% upper limits span L 2 − 10 keV ≲ ( 2 CLOSE L_{\rm 2-10~keV}\lesssim(2 – OPEN 13 ) × 10 43 erg s − 1 13)\times 10^{43}~\mathrm{erg~s^{-1}} . Stacking all 21 galaxies ( ∼ 17 \sim 17 Ms total exposure) yields no significant signal and constrains the average luminosity to L 2 − 10 keV ≤ 9.54 × 10 42 erg s − 1 L_{\rm 2-10~keV}\leq 9.54\times 10^{42}~\mathrm{erg~s^{-1}} . See Sections III.1 and III.2 .
- 2610.19317v1: Deep X-ray View of a Distant Protocluster Anchored by a Quasar at $z=6.63$: No Evidence for Enhanced X-ray AGN Activity
The upper boundary of the central 90% Jeffreys credible interval on the X-ray AGN fraction is f AGN < 0.09 f_{\rm AGN}<0.09 . In the partial fixed-threshold comparison at log ( L X / erg s − 1 ) = 43.8 \log(L_{\rm X}/\mathrm{erg~s^{-1}})=43.8 , the limit becomes f AGN < 0.10 f_{\rm AGN}<0.10 for zero detections among 18 sufficiently sensitive members, while the reclassified literature fractions span 0.02–0.25. The data provide no evidence for an enhanced X-ray AGN fraction in J0910 − - 0414. See Section III.4 .
- 2610.19317v1: Deep X-ray View of a Distant Protocluster Anchored by a Quasar at $z=6.63$: No Evidence for Enhanced X-ray AGN Activity
To our knowledge, this work provides the first systematic X-ray census of AGN activity among member galaxies in a z > 6 z>6 protocluster. After normalizing the field XLF expectation by the observed galaxy overdensity, we find no evidence for an additional enhancement of X-ray-detectable AGN and constrain it to η rel < 17.5 \eta_{\rm rel}<17.5 at 90% confidence. This upper limit is not sufficiently stringent to determine why no member AGN is detected. Deeper X-ray observations of additional spectroscopically confirmed z > 6 z>6 protoclusters will be needed to distinguish obscured or intrinsically X-ray-weak AGN from short-lived X-ray-bright accretion phases or a genuinely low overall AGN incidence. Broader member censuses, including submillimeter-selected dusty galaxies, will also be required to determine whether constraints from predominantly emission-line-selected samples extend to the full protocluster galaxy population.
- 2610.19317v1: Deep X-ray View of a Distant Protocluster Anchored by a Quasar at $z=6.63$: No Evidence for Enhanced X-ray AGN Activity
We ran wavdetect on the merged full-band image and matched the resulting point sources to Gaia DR3 [ 42 ] . Eighteen unique one-to-one matches lie within 1 ″ 1\arcsec . The median signed offsets, defined as X-ray minus Gaia , are Δ R . A . cos ( Decl . ) = − 0.03 ″ \Delta\mathrm{R.A.}\cos(\mathrm{Decl.})=-0.03\arcsec and Δ Decl . = + 0.01 ″ \Delta\mathrm{Decl.}=+0.01\arcsec ; the median radial separation is 0.26 ″ 0.26\arcsec , and 68% of the matches lie within 0.44 ″ 0.44\arcsec . A 1000-trial shifted-position test, using random displacements of 10–30″, predicts 0.46 chance associations within the adopted matching radius.
- 2610.19317v1: Deep X-ray View of a Distant Protocluster Anchored by a Quasar at $z=6.63$: No Evidence for Enhanced X-ray AGN Activity
To generate the preliminary candidate source list, we applied wavdetect to the merged raw images in the full, soft, and hard bands using a false-positive probability threshold of 10 − 6 10^{-6} . The resulting source lists from the three bands were then cross-matched with a matching radius of 3 ″ 3\arcsec to produce a merged source list. For sources detected in multiple bands, the X-ray positions were adopted from the full-band, soft-band, or hard-band detections in order of priority. This procedure yielded a preliminary list of 262 candidate sources. We used srcflux to extract the X-ray photometric properties of these sources and retained sources with a binomial no-source probability of P B < 0.01 P_{\rm B}<0.01 in at least one band. Our final catalog consists of 251 sources detected in one or more X-ray bands, of which 247 are detected in the full band.
- 2610.19317v1: Deep X-ray View of a Distant Protocluster Anchored by a Quasar at $z=6.63$: No Evidence for Enhanced X-ray AGN Activity
For each target, we began with the source-masked image and additionally masked all other targets in the same manner. We used the resulting image for aperture photometry and stacking.
- 2610.19317v1: Deep X-ray View of a Distant Protocluster Anchored by a Quasar at $z=6.63$: No Evidence for Enhanced X-ray AGN Activity
Because the adopted XLF describes Compton-thin AGN and is extrapolated slightly beyond its calibrated redshift range, the resulting limits apply only to the X-ray-detectable Compton-thin population, not to the total incidence of SMBH accretion. The cumulative LAE profile was measured over | Δ v | < 2250 km s − 1 |\Delta v|<2250~\mathrm{km~s^{-1}} , which is narrower than the full Δ z = 0.2 \Delta z=0.2 interval adopted here. The overdensity correction also assumes that LAEs trace the relevant population of potential X-ray AGN hosts. Therefore, η rel \eta_{\rm rel} should be regarded as an approximate environment-normalized constraint under these assumptions.
- 2610.19317v1: Deep X-ray View of a Distant Protocluster Anchored by a Quasar at $z=6.63$: No Evidence for Enhanced X-ray AGN Activity
The remainder of this paper is organized as follows. Section II summarizes the Chandra observations, X-ray source catalog, and survey sensitivity. Section III analyzes the X-ray properties and AGN incidence of the protocluster members and interprets the non-detections. Section IV summarizes our conclusions. Appendix A presents the detailed X-ray survey and catalog construction, and Appendix B presents the spectral analyses of four hard X-ray sources.
- 2512.03433v1: A Deep Chandra X-ray Survey of a Luminous Quasar Sample at $z\sim$ 7
Table 1: Summary of Chandra ACIS-S Observations
- 2512.03433v1: A Deep Chandra X-ray Survey of a Luminous Quasar Sample at $z\sim$ 7
In this section, we study the X-ray photometric and spectroscopic properties of quasars at z > 6.5 z>6.5 , and investigate their relations with quasar and host galaxy properties measured from NIR spectroscopy and ALMA observations.
- 2608.10070v1: A cosmic collision in the making: JWST/NIRISS reveals a merging and maturing protocluster core at z~3 around a red quasar
We have presented a newly discovered protocluster dubbed “The Step” at z ∼ 3 z\sim 3 unveiled by JWST/NIRISS grism observations targeting the overdense field around the luminous quasar and starburst J1652 ( z spec = 2.9489 z_{\rm spec}=2.9489 ). Previous NIRSpec IFU observations had already unveiled 3 galaxies within a projected radius of < 12 <12 kpc from the quasar at a velocity offset of ∼ 500 − 700 \sim 500-700 km/s ( Wylezalek et al., 2022 ) . The NIRISS observations confirm this previously reported overdensity. Our results are as follows:
- 2608.10070v1: A cosmic collision in the making: JWST/NIRISS reveals a merging and maturing protocluster core at z~3 around a red quasar
The system is composed of two structures, which may be in the process of merging (discussed in Section 3.5 ), given the separation of Northern versus Southern sources in the 3D position-velocity space, creating a step-like pattern (Fig 5 ). This may also explain the large velocity spread in the densest region ( 700 700 km/s between 4 4 galaxies spanning projected distances of < 20 <20 kpc between each other), and enhanced galaxy merger activity may have caused the extended tidal tail detected in the stellar continuum ( Wylezalek et al., 2022 ) .
- 2504.18616v1: Insights on Metal Enrichment and Environmental Effect at $z\approx5-7$ with JWST ASPIRE/EIGER and Chemical Evolution Model
Galaxies in overdense environments exhibit a steeper MZR slope ( γ = 0.42 ± 0.04 \gamma=0.42\pm 0.04 ) compared to field galaxies ( γ = 0.21 ± 0.06 \gamma=0.21\pm 0.06 ), and they are more metal-rich especially at higher masses log ( M ∗ / M ⊙ ) > 8 \log(M_{*}/M_{\odot})>8 . We build a mass-matched sample of field galaxies and still find that the galaxies in overdense environments are more metal-rich by ∼ 0.2 \sim 0.2 dex than their field counterparts with the same stellar masses.
- 2504.18616v1: Insights on Metal Enrichment and Environmental Effect at $z\approx5-7$ with JWST ASPIRE/EIGER and Chemical Evolution Model
We compare the FMR of our sample galaxies with the local FMR using α = 0.66 \alpha=0.66 ( Andrews & Martini, 2013 ) . We find that our sample galaxies are metal-deficient by 0.2 0.2 dex compared to the local FMR. However, the galaxies in overdense environments align closer to the local FMR predictions.
- 2607.21719v1: Outflows in super-Eddington quasars drive clumpy circumgalactic medium and extended H$α$ nebulae at $z \gtrsim 6$
The results obtained in this work highlight that the central engine remains undetected and goes through obscured growth for most of its lifetime (see Fig. 3 ). We further show that H α \rm H\alpha nebular emission directly probes the obscuration stage of the accreting SMBH, with profiles remaining centrally concentrated and dropping off steeply when heavily obscured, even after a sustained bright quasar phase lasting around 1 Myr 1~{\rm Myr} . While the nebular emission shown in the left panel of Fig. 13 could be observationally attributed to short-lived quasar lifetimes, we rather find that it is associated with a period of intense accretion and radiation output that is heavily obscured. Such constant ‘lightbulb’ scenarios, however, are unlikely to be realistic because quasar light curves show significant variability. Nonetheless, Satyavolu et al. (2023) show that quasars with small duty cycle ( < 10 per cent <10~{\rm per~cent} ) and short active periods ( t quasar ∼ 10 4 yr t_{\rm quasar}\sim 10^{4}~{\rm yr} ) can reconcile measurements of both small and large proximity zones assuming that much of the black hole’s growth is obscured. Future radiative transfer simulations using realistic light curves from the simulations will enable us to study the effect of quasar variability (whose luminosity may vary rapidly by 1–2 dex) on lifetime estimates and provide further theoretical support for obscured growth and short but bright radiative phases in high-redshift quasars.
- 2607.21719v1: Outflows in super-Eddington quasars drive clumpy circumgalactic medium and extended H$α$ nebulae at $z \gtrsim 6$
Figure 8: Visual overview of the ionization state of the CGM in the suite of simulations at z = 6.01 z=6.01 . Here, gas is assumed to be in ionization equilibrium with a meta-galactic UVB. From left to right, the different columns show results for the NoAGN, fable and fable -sE simulations, respectively. The upper row displays the density-weighted neutral hydrogen fraction ( x H i x_{\text{H\,{i}}{}} ), while the lower row shows 2D bivariate projections of the neutral hydrogen column density ( N H i N_{\text{H\,{i}}{}} ) and density-weighted radial velocity ( v rad v_{\rm rad} ). This visualisation enables the simultaneous tracing of outflows and dense, neutral gas. The bivariate colourmap is shown as an inset in the bottom left panel, with the brightness/saturation reflecting the column density and the hue displaying the radial velocity. White contours delineate DLA sightlines ( N H i > 10 20.3 cm − 2 N_{\text{H\,{i}}{}}>10^{20.3}~{\rm cm^{-2}} ). In the lower panels, the full and dashed circles display the virial radius and R = 50 R=50 kpc, respectively. A large fraction of the CGM in the hot, diffuse phase is ionized by the UVB. Along the cosmic filaments and in the central galaxy, we have x H i > 0.1 x_{\text{H\,{i}}}{}>0.1 such that the column density is very high. We note that many more lines of sight are covered by dense and neutral gas in the fable -sE simulation, up to and beyond the virial radius. This excess of gas compared to the two other runs is almost entirely made up of outflowing gas clumps that arise from strong AGN feedback in fable -sE.
- 2609.17680v1: A dense, metal-rich absorber driven by a heavily dust-obscured galaxy: The direct evidence of CGM enrichment at $z\sim7$
The C II/C IV column density ratio at z = 7.03 z=7.03 falls within 0.3 dex of the empirical redshift-dependent trend established by the XQR-30 legacy survey of z ≳ 5 z\gtrsim 5 quasar absorbers [ 42 ] , consistent with the global trend toward increasingly neutral, low-ionization CGM environments in the Epoch of Reionization (see Section IV.2 ). This concordance arises because the extraordinary metal column densities are enhanced uniformly across all ionization phases, preserving the standard relative ionic balance despite the absolute enrichment. At the current single-object precision the observation does not require any significant departure from the low- z z ionization balance.
- 2609.17680v1: A dense, metal-rich absorber driven by a heavily dust-obscured galaxy: The direct evidence of CGM enrichment at $z\sim7$
The unique physical regime revealed by this system, an extreme absorber intercepted at only 16 kpc from a heavily dust-obscured, vigorously star-forming host, points to two natural next steps. First, higher-spectral-resolution (e.g., R ∼ 10000 R\sim 10000 ) follow-up will be essential to constrain individual cloud b b -parameters. Only with the, break the saturation degeneracy in the column-density estimates, and more robustly characterize the underlying nucleosynthetic pattern. Second, if the enhanced [C/O] observed here is indeed a Pop III imprint, quasar-absorption spectroscopy toward confirmed high- z z galaxy–absorber pairs may prove a complementary route to probing Pop III enrichment, sidestepping the challenge of directly detecting individual Pop III stellar systems. Realizing both goals requires a systematic effort to identify high- z z absorber hosts even when they are NIR-dark, motivating targeted millimeter and sub-millimeter follow-up of high- z z metal-absorber fields with ALMA and NOEMA.
- 2607.26255v1: Tracing the Cosmic web across Cosmic time through SKA observations of radio galaxies
The quantitative scale of this programme is set by both SKA forecasts and SKA pathfinder results. Forecasts for an SKA1-Mid all-sky continuum survey such as SASS1 predict ∼ 5 × 10 8 \sim 5\times 10^{8} radio sources at ∼ 2 ′′ \sim 2^{\prime\prime} resolution and 2 μ Jy beam − 1 2~\upmu\mathrm{Jy~beam^{-1}} rms ( Norris et al., 2015 ) . Recent EMU results already demonstrate that automated radio-galaxy cataloguing can operate at the required scale. In the 270 deg 2 270~\mathrm{deg^{2}} EMU pilot survey, the RG-CAT pipeline produced 211,625 211{,}625 radio sources, including 10,414 10{,}414 extended radio sources ( Gupta et al., 2024 ) . The same work achieved IoU > 0.5 \mathrm{IoU}>0.5 for 99% of central radio-galaxy bounding boxes and placed 98% of predicted host positions within 3 ′′ 3^{\prime\prime} of the ground-truth CatWISE host. More recently, EMUSE applied morphology-based retrieval to first-year EMU main-survey data, covering ∼ 4,500 deg 2 \sim 4{,}500~\mathrm{deg^{2}} , with ∼ 3 × 10 6 \sim 3\times 10^{6} detected radio sources and ∼ 1.7 × 10 5 \sim 1.7\times 10^{5} extended radio sources suitable for similarity search ( Gupta et al., 2025 ) . These precursor results show that a conservative SKA-era expectation of > 10 5 >10^{5} morphologically measurable radio galaxies is well grounded; first-year EMU-scale data already reach this order of magnitude for extended-source samples, and SKA depth, resolution, and sky coverage should expand the accessible population substantially. Citizen-science programmes could provide a complementary route for inspecting complex, rare, or ambiguous radio morphologies, while also generating validated training and test samples for increasingly automated machine-learning classification ( Hota et al., 2026 ) .
- 2607.26255v1: Tracing the Cosmic web across Cosmic time through SKA observations of radio galaxies
In this chapter, we have reviewed how radio galaxies trace, respond to, and influence the large-scale structure of the Universe, and outlined how the SKA, together with complementary multi-wavelength facilities, can turn these connections into quantitative and testable probes of cosmic-web evolution.
- 2506.06418v1: The Identification of Two JWST/NIRCam-Dark Starburst Galaxies at $z=6.6$ with ALMA
We analyze two dusty star-forming galaxies at $z=6.6$. These galaxies are selected from the ASPIRE survey, a JWST Cycle-1 medium and ALMA Cycle-9 large program targeting 25 quasars and their environments at $z\simeq6.5 - 6.8$. These galaxies are identified as companions to UV-luminous quasars and robustly detected in ALMA continuum and [C II] emission, yet they are extraordinarily faint at the NIRCam wavelengths (down to $>28.0$ AB mag in the F356W band). They are more obscured than galaxies like Arp220, and thus we refer to them as "NIRCam-dark" starburst galaxies (star formation rate $\simeq 80 - 250\,\mathrm{M}_{\odot}\,\mathrm{yr}^{-1}$). Such galaxies are typically missed by (sub)-millimeter blank-field surveys. From the star-formation history (SFH), we show that the NIRCam-dark galaxies are viable progenitors of massive quiescent galaxies at $z\gtrsim4$ and descendants of UV-luminous galaxies at $z>10$. Although it is hard to constrain their number density from a quasar survey, we conclude that NIRCam-dark galaxies can be as abundant as $n\sim10^{-5.5}$ Mpc$^{-3}$ assuming a light halo occupation model. If true, this would equal to $\sim$30% of the number densities of both the quiescent galaxies at $z\gtrsim4$ and UV-luminous galaxies at $z>10$. We further predict that analogs at $z\sim8$ should exist according to the SFH of early massive quiescent galaxies. However, they may fall below the current detection limits of wide JWST and ALMA surveys, thus remaining "JWST-dark". To fully trace the evolution of massive galaxies and dust-obscured cosmic star formation at $z\gtrsim8$, wide-field JWST/NIRCam imaging and slitless spectroscopic surveys of early protoclusters are essential.
- 2503.07074v1: JWST ASPIRE: How Did Galaxies Complete Reionization? Evidence for Excess IGM Transmission around ${\rm [O\,{\scriptstyle III}]}$ Emitters during Reionization
The spatial correlation between galaxies and the Ly α \alpha forest of the intergalactic medium (IGM) provides insights into how galaxies reionized the Universe. Here, we present initial results on the spatial cross-correlation between [ O III ] {\rm[O\,{\scriptstyle III}]} emitters and Ly α \alpha forest transmission at 5.4 < z < 6.5 5.4<z<6.5 from the JWST ASPIRE NIRCam/F356W Grism Spectroscopic Survey in z > 6.5 z>6.5 QSO fields. Using data from five QSO fields, we find 2 σ 2\sigma evidence for excess Ly α \alpha forest transmission at ∼ 20 − 40 cMpc \sim 20-40\,\rm cMpc around [ O III ] {\rm[O\,{\scriptstyle III}]} emitters at ⟨ z ⟩ ≃ 5.86 \langle z\rangle\simeq 5.86 , indicating that [ O III ] {\rm[O\,{\scriptstyle III}]} emitters reside within a highly ionized IGM. At smaller scales, the Ly α \alpha forest is preferentially absorbed, suggesting gas overdensities around [ O III ] {\rm[O\,{\scriptstyle III}]} emitters. Comparing with models, including THESAN cosmological radiation hydrodynamic simulations, we interpret the observed cross-correlation as evidence for significant large-scale fluctuations of the IGM and the late end of reionization at z < 6 z<6 , characterized by ionized bubbles over 50 cMpc 50\rm\,cMpc around [ O III ] {\rm[O\,{\scriptstyle III}]} emitters. The required UV background necessitates an unseen population of faint galaxies around the [ O III ] {\rm[O\,{\scriptstyle III}]} emitters with average LyC leakage of log 10 ⟨ f esc ξ ion ⟩ / [ erg − 1 Hz ] ≃ 24.5 \log_{10}\langle f_{\text{esc}}\xi_{\text{ion}}\rangle/[{\text{erg}^{-1}\text{Hz}}]\simeq 24.5 down to M UV = − 10 M_{\text{UV}}=-10 . Furthermore, we find that the number of observed [ O III ] {\rm[O\,{\scriptstyle III}]} emitters near individual transmission spikes is insufficient to sustain reionization in their surroundings, even assuming all [ O III ] {\rm[O\,{\scriptstyle III}]} emitters harbour AGN with 100 % 100\,\% LyC escape fractions. Despite broad agreement, a careful analysis of ASPIRE and THESAN, using the observed host halo mass from the clustering of [ O III ] {\rm[O\,{\scriptstyle III}]} emitters, suggests that the simulations underpred
- 2503.07074v1: JWST ASPIRE: How Did Galaxies Complete Reionization? Evidence for Excess IGM Transmission around ${\rm [O\,{\scriptstyle III}]}$ Emitters during Reionization
This completion of late reionization requires faint galaxies below our detection limit. The enhanced large-scale UV background for the excess Ly α \alpha forest transmission demands a collective population of fainter galaxies surrounding the observed [ O III ] {\rm[O\,{\scriptstyle III}]} emitters. The observed [ O III ] {\rm[O\,{\scriptstyle III}]} emitters fall short of providing the necessary ionizing budget, assuming reasonable values for the LyC escape fraction and ionizing photon production efficiency. Our analysis of the individual associations between [ O III ] {\rm[O\,{\scriptstyle III}]} emitters and Ly α \alpha forest transmission spikes further indicates that the LyC leakage from these emitters does not generate enough ionizing radiation to maintain the high ionization levels of the surrounding IGM, as evidenced by the presence of Ly α \alpha forest transmission spikes. This conclusion holds true even if we assume that all [ O III ] {\rm[O\,{\scriptstyle III}]} emitters host AGN activities and exhibit 100 % 100\,\% LyC escape fractions, suggesting that AGN alone are insufficient to drive reionization. Generally, an average LyC leakage of log 10 ⟨ f esc ξ ion ⟩ / [ erg − 1 Hz ] ≈ 24.5 \log_{10}\langle f_{\rm esc}\xi_{\rm ion}\rangle/[{\rm erg^{-1}Hz}]\approx 24.5 down to galaxies with M UV ≈ − 10 M_{\rm UV}\approx-10 is required to establish a sufficient UV background. Thus, we conclude that an unseen population of fainter galaxies, or systems not selected as [ O III ] {\rm[O\,{\scriptstyle III}]} emitters (or luminous populations residing outside the single NIRCam/WFSS field of view), is responsible for completing reionization.
Abstract
Whether dense environments accelerate SMBH growth during cosmic reionization remains uncertain because X-ray constraints on $z>6$ protoclusters are rare. We analyze $\sim865$ ks of Chandra observations of J0910-0414 quasar field, a massive protocluster at $z=6.63$. We construct a catalog of 251 X-ray sources and search for AGN among 21 spectroscopically confirmed members, excluding the central quasar. This is the first systematic X-ray AGN census in a $z>6$ protocluster; none of the members is individually detected. Stacking all members ($\sim17$ Ms total exposure) yields no significant signal and limits the average rest-frame 2-10 keV luminosity to $\langle L_{\rm 2-10~keV}\rangle\leq9.54\times10^{42}~\rm erg~s^{-1}$. The null result gives a central 90% Jeffreys upper bound of $f_{\rm AGN}<0.09$. After accounting for the spatially varying sensitivity, the field Compton-thin X-ray luminosity function predicts $N_{\rm exp,field}=0.0356$ AGN in the surveyed volume. Assuming the overdensity profile of AGNs in this protocluster is the same as that of galaxies determined by Wang et al. (2024), the expected AGN count becomes $N_{\rm exp}=0.131$. Zero detections then imply a one-sided 90% upper limit of $η_{\rm rel}<17.5$ on any additional X-ray AGN enhancement beyond that associated with the galaxy overdensity. Although $η_{\rm rel}<17.5$ permits more than an order-of-magnitude enhancement, the data show no significant excess of X-ray-detectable AGN in J0910-0414 protocluster. The present X-ray data may miss heavily obscured, intrinsically X-ray-weak, or intermittently accreting SMBHs; the non-detection therefore does not rule out AGNs among the member galaxies.
Discussion
Discussion access requires a security token. Register for the weekly digest.