Weekly issue · Oct 12–18, 2026

Week 42, 2026

10 curated papers

A heterogeneous set of unusual quasars selected from astrometry and broad-band photometry

C. Cheng, K. Valeckas, L. Christensen et al.

Gaia zero-motion selection plus broad-band colours and spectroscopy confirmed 21 quasars among 24 candidates, disproportionately finding BAL quasars in photometrically transitional regions. One low-redshift normal quasar is described as LRD-like, but this is not a high-redshift LRD sample.

What changes The principal result is empirical mapping of spectroscopic classes across clean and transitional g−r versus J−K regions: the stellar-region target was a star, all four safe-quasar targets were normal quasars, and all ten confirmed quasars in transitional regions were BALs. This supports an association between colour ambiguity and BAL incidence, not a demonstrated causal mechanism. The lowest-z quasar (z=0.139) is only said to be reminiscent of an LRD; no matched LRD spectral, size, or physical-property analysis is reported.
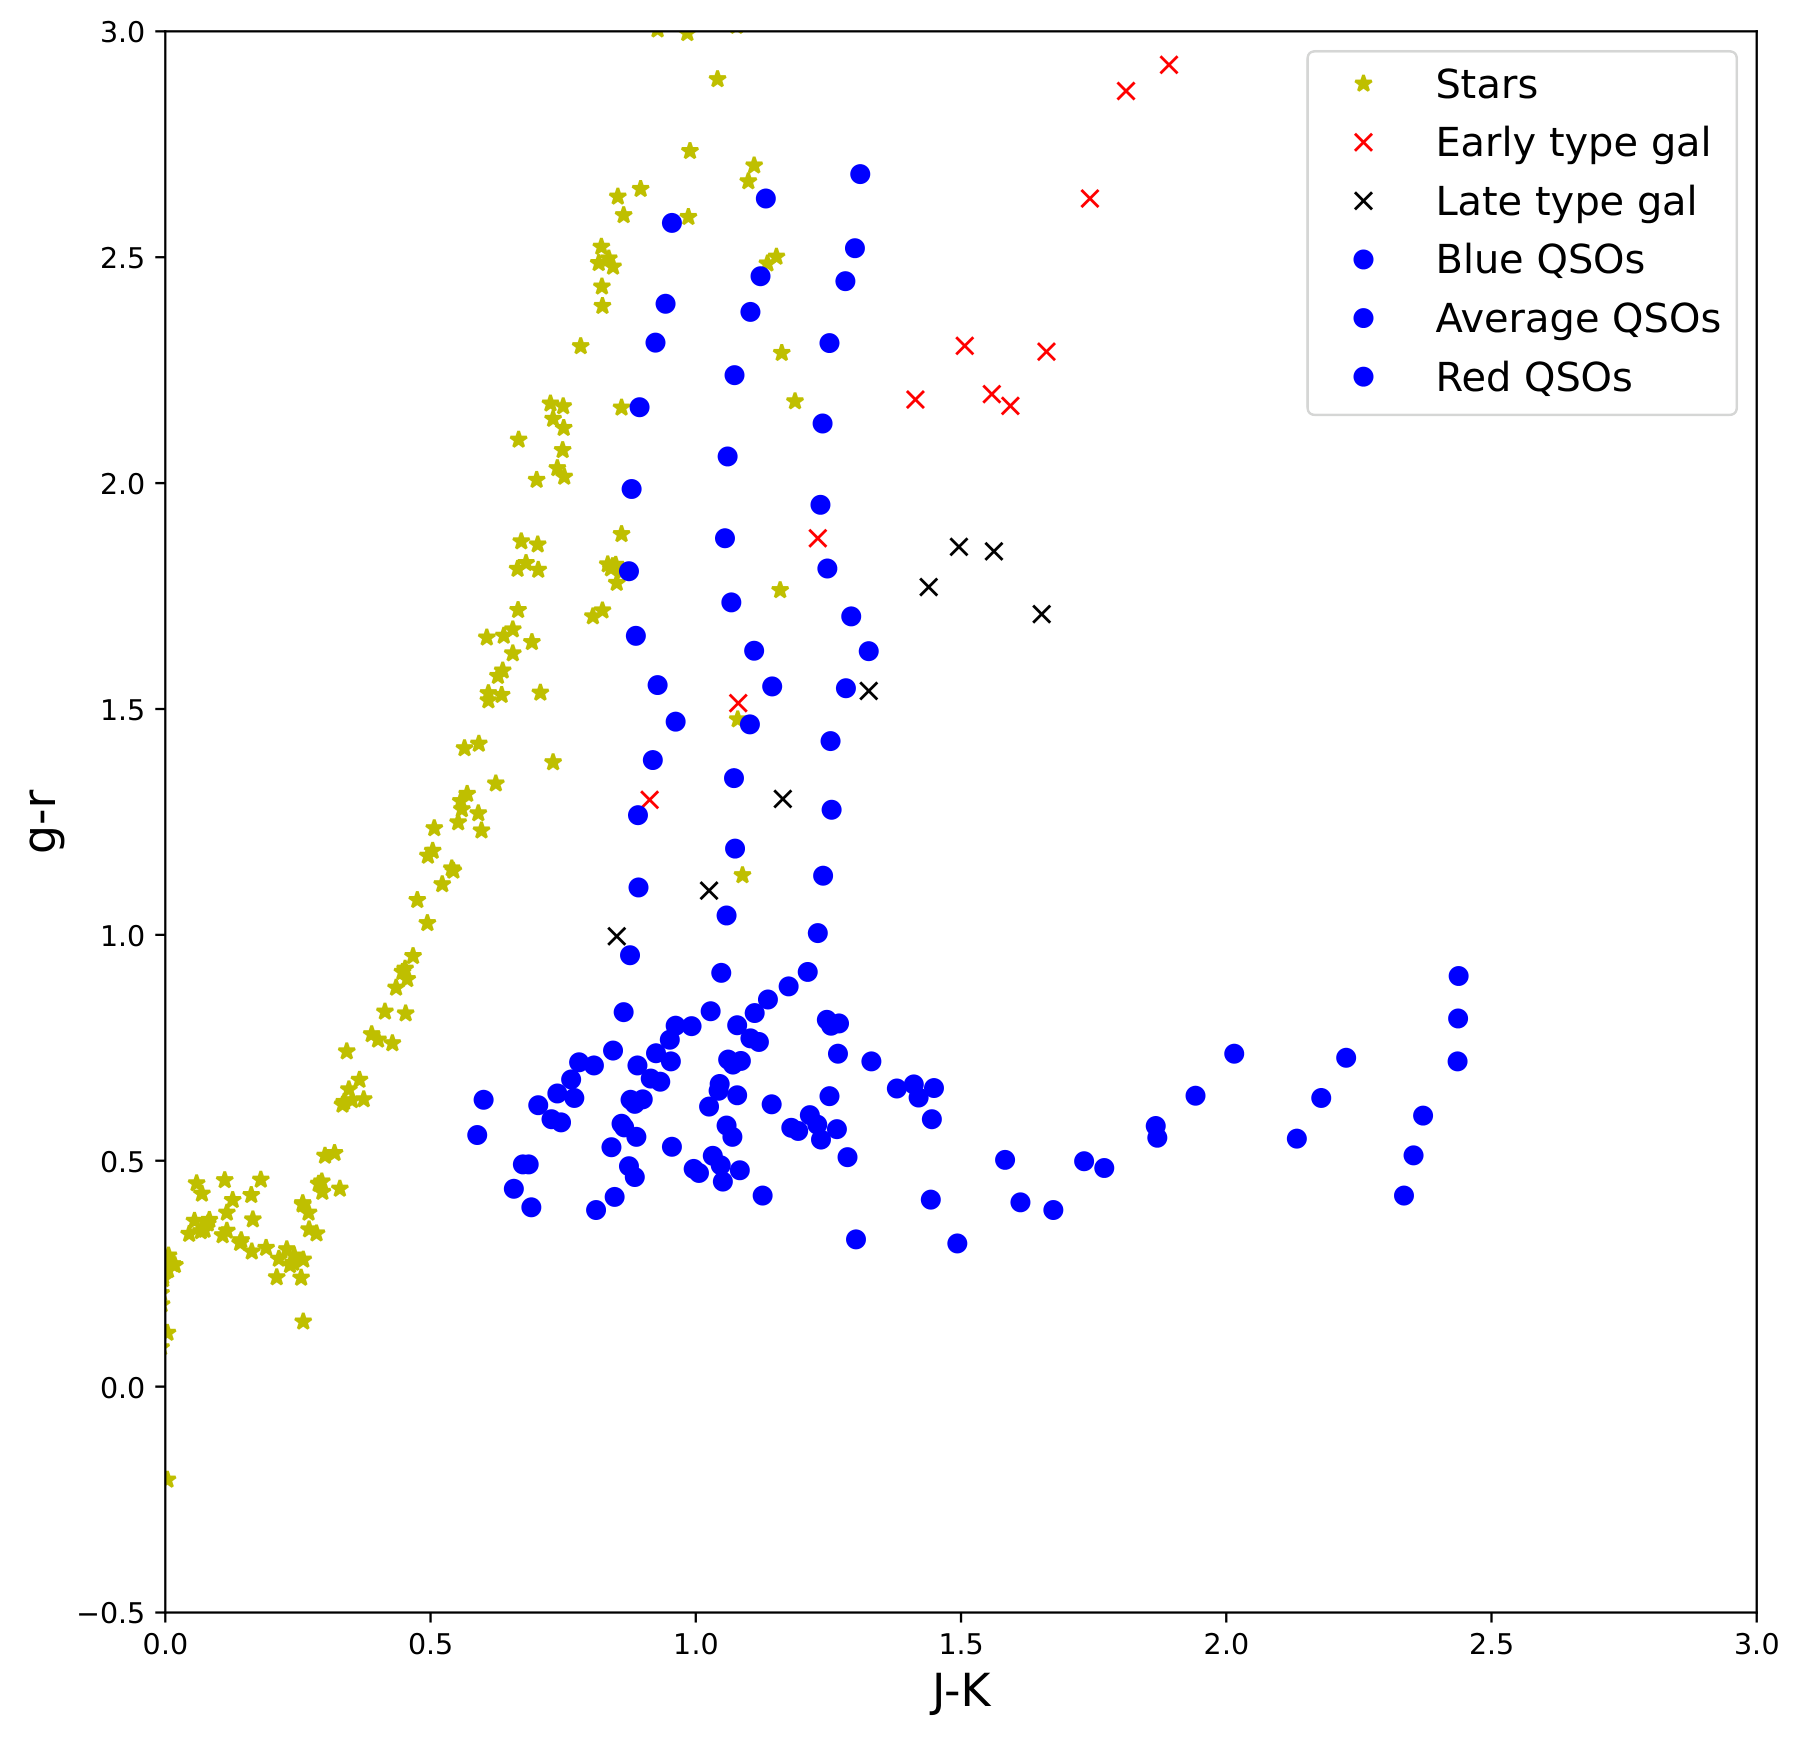
Figure 2 from A heterogeneous set of unusual quasars selected from astrometry and broad-band photometryFigure 2 · Open paper
Figure notes (3)
  • Figure 2. Tests whether theoretical stellar, galaxy, and quasar colour tracks correspond to the observed master catalogue and confirmed-object locations—the basis for defining cleaner versus ambiguous photometric regions.
  • Figure 28. Plots fitted AV against redshift for confirmed quasars, testing the reported tendency for the most extinguished objects to occur mainly at lower redshift rather than establishing a quantitative evolutionary relation.
  • Figure 30. Places spectroscopically observed targets against the full zero-proper-motion population in optical/near-IR and WISE/near-IR colour planes, testing how redshift, fitted extinction, and spectral class populate the selection space.
A radio counterpart of the local little-red-dot J092359+415736

Tao An, Ruqiu Lin, Ailing Wang

Archival 0.144–3.0 GHz imaging identifies persistent, variable radio emission from the z≈0.323 local LRD J092359+415736. Its flat spectrum and star-formation shortfall favor accretion, but existing beams cannot isolate nuclear emission.

What changes The main advance is temporal radio information for a local LRD: a 26-year brightening inference plus tentative shorter-timescale 3-GHz variability, rather than a single radio detection. The analysis also explicitly tests alternatives: decades-long recovery disfavors an ordinary radio supernova or tidal-disruption event, while scintillation remains possible only for an ultracompact nuclear emitter. The SED appendix characterizes the optical–near-IR continuum with two blackbodies (4583 and 2086 K), not an AGN torus decomposition.

Figure notes (3)
  • Figure 1. Tests long-baseline and multi-frequency variability by plotting fitted flux densities from ten independent archival epochs. Frequencies are deliberately not rescaled, so spectral and temporal changes must be interpreted jointly; error bars are total uncertainties.
  • Figure 2. Tests whether the optical–near-IR continuum occupies the luminosity/temperature space of previously reported gas-reddened AGNs/LRDs. It displays a two-blackbody characterization (4583 and 2086 K), rather than establishing a physical torus or stellar-population decomposition.
  • Figure 4. Tests the low-frequency counterpart and positional association: the LoTSS 144-MHz image contains a compact 2.13 mJy beam⁻¹, 42σ source within the Gaia-position circle, while identifying a brighter source 71 arcsec away as unrelated. The 6-arcsec beam does not resolve nuclear-scale structure.

A Vision for Little Red Dots in the Low-Redshift Universe with ALMA2040

Fengwu Sun, Xiaojing Lin, Miguel Pereira-Santaella et al.

Forecasts for one z=0.1007 LRD suggest ALMA2040 could constrain its CO-traced gas reservoir, but a dynamical black-hole test requires optimistic CO brightness and long exposure; a 10^6-M⊙ black hole remains inaccessible.

What changes The paper translates local-LRD accessibility into quantitative ALMA2040 experiments: first a CO detection/gas-depletion-time constraint, then a resolved dynamical test. At 209 GHz, a 14.6-mas (27-pc) beam would place about 3.7 beams across an assumed 100-pc gas effective radius. In an optimistic 50-h, αCO≈70 simulation, forward modelling of a spectral cube could distinguish a 10^7-M⊙ BH from no BH through steeper central velocities/high-velocity structure, thereby testing an illustrative BH-to-stellar mass ratio of 0.01.

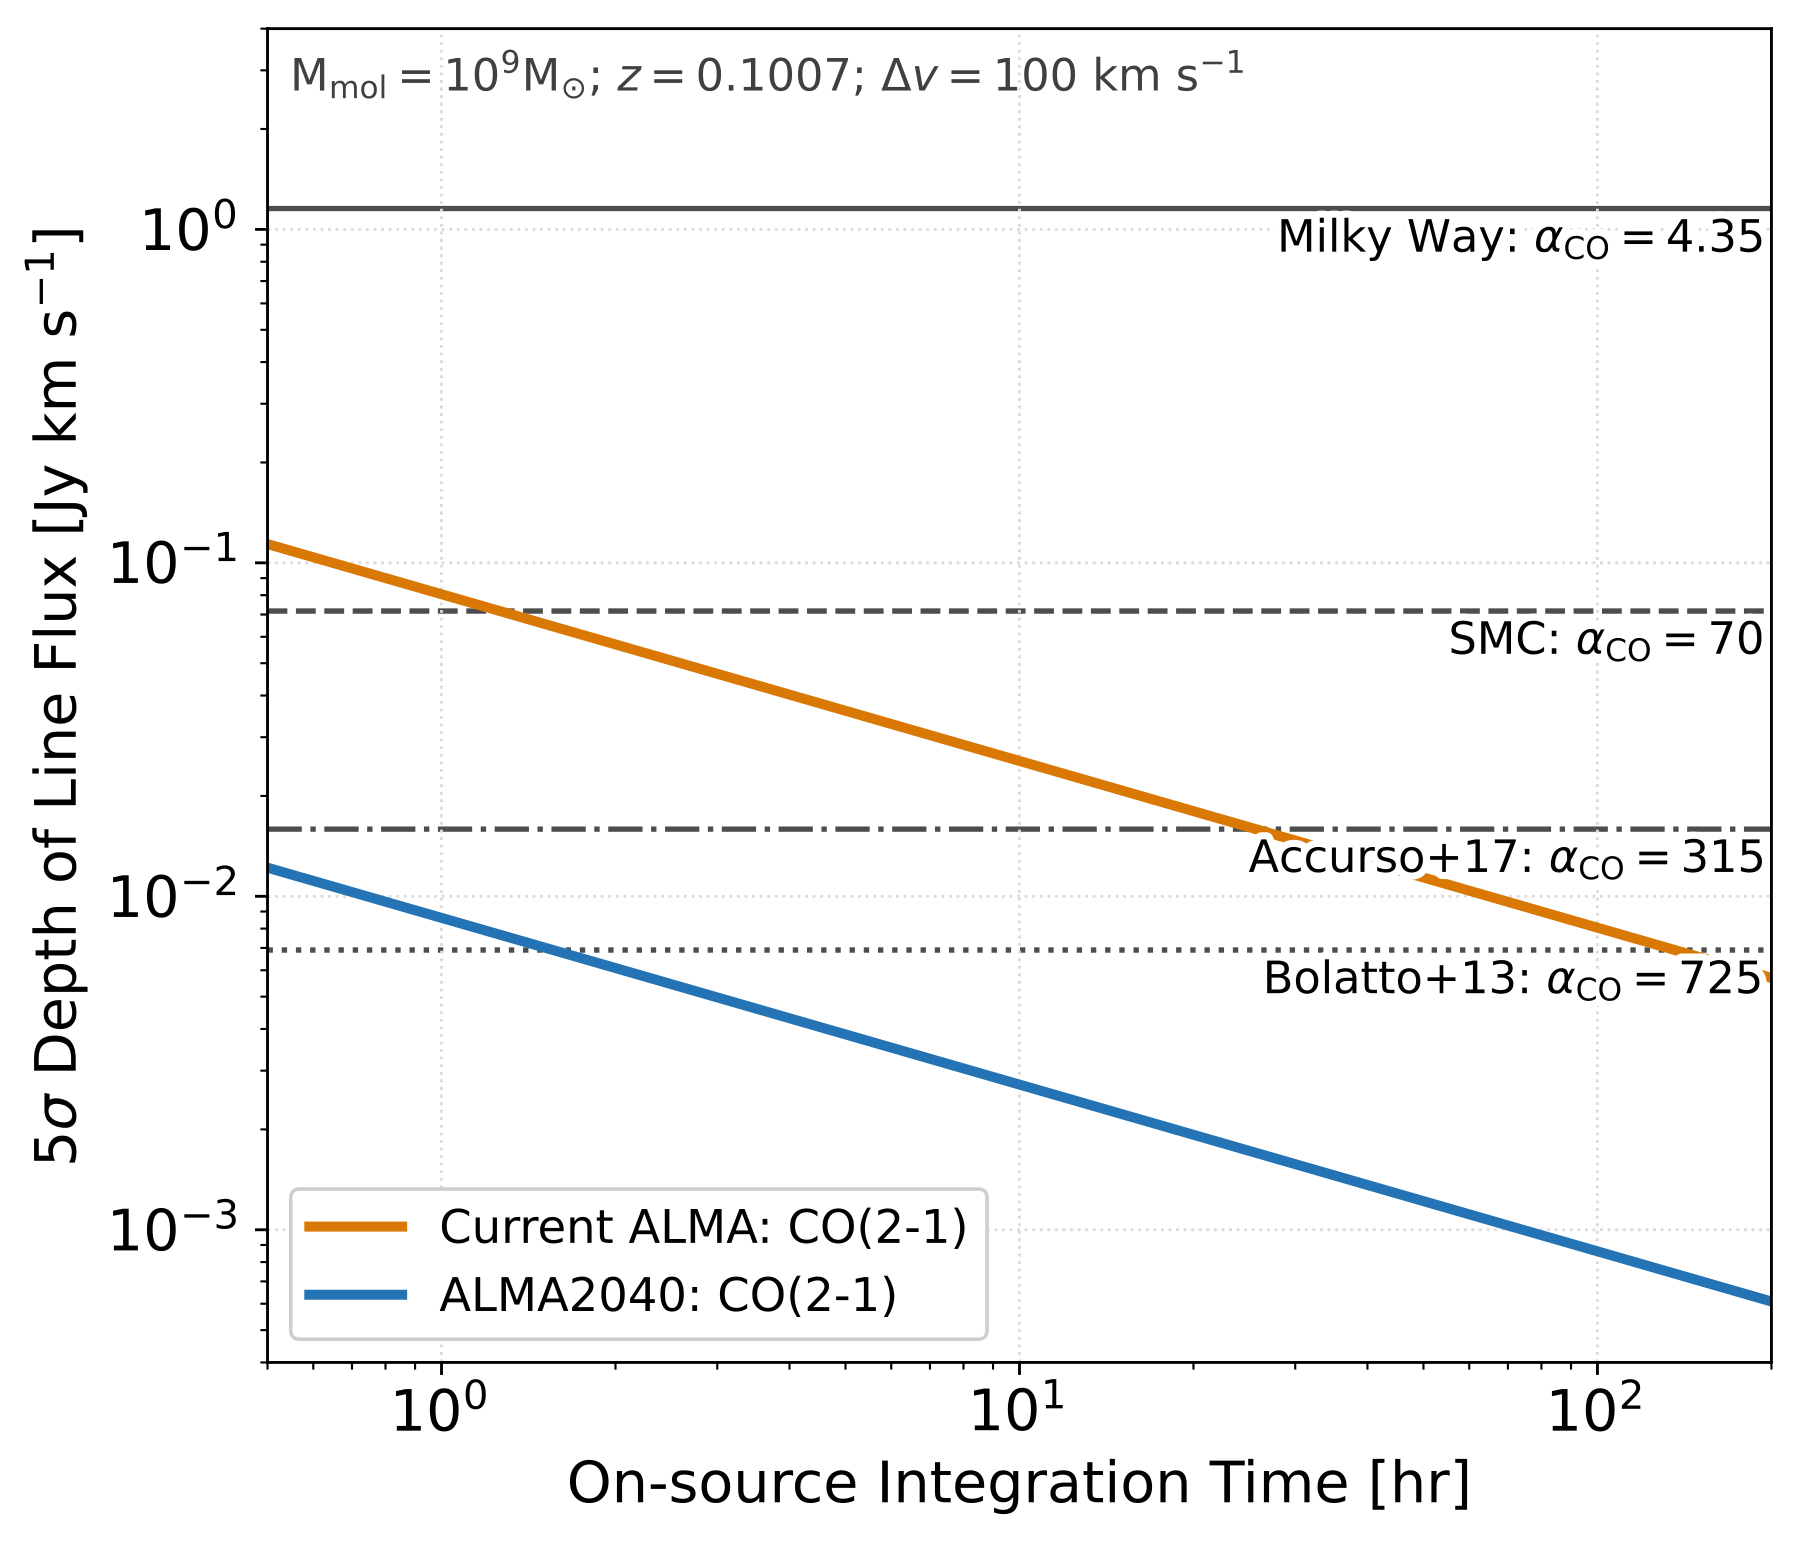
Figure 2 from A Vision for Little Red Dots in the Low-Redshift Universe with ALMA2040Figure 2 · Open paper
Figure notes (1)
  • Figure 2. Left panel tests how the 5σ CO(2–1) detection threshold at The Egg’s redshift changes from current ALMA to ALMA2040 as αCO changes for a fixed 10^9-M⊙ gas assumption. Right panel tests whether simulated resolved kinematics can discriminate BH masses: under αCO=70 and 50 h, only the 10^7-M⊙ model shows diagnostic central high-velocity structure relative to no BH; 10^6 M⊙ does not.

The Dance of the Little Red Dots: Spectroscopy of Two Blue Companions at z = 3.9 and 5.5 Reveals Young, Metal-Poor Starbursts Merging with Their LRDs within a Few Hundred Myr

Fabio Pacucci, Pierluigi Rinaldi

Spectroscopy of two LRD–blue-companion pairs confirms small line-of-sight velocity offsets and young, metal-poor companion starbursts. Orbital modeling favors a merger for Tango and conditionally for Waltz, while the proposed heavy-seed connection remains interpretive.

What changes The reported advance is spectroscopic confirmation for both members of two LRD–companion systems, including resolved velocity differences and companion spectral characterization. The authors link the companions’ youth and low metallicity to a synchronized-pair/direct-collapse picture. For Waltz, they report an approximately 3×10^6 M⊙ black hole accreting at about half Eddington; combining its conditional binding requirement with halo-growth arguments yields alternative old-seed/bound and young-seed/unbound readings. This is a model-dependent interpretation rather than a direct seed-formation measurement.

Figure notes (3)
  • Figure 1. Tests whether each blue source is spatially distinct from its LRD. Rest-frame optical F444W is LRD-dominated, while F277W ([O III]+Hβ at Waltz’s redshift) and the Tango IFU [O III] map reveal distinct companion emission; projected separations are 3.57 and 2.54 kpc.
  • Figure 2. Tests spectroscopic association through [O III] centroid offsets. It measures +131.6±3.3 km s⁻¹ for Waltz and −56.8±0.7 km s⁻¹ for Tango, while explicitly leaving transverse velocities unconstrained.
  • Figure 4. Tests dynamical plausibility using Monte Carlo ensembles of 6,000 orbits per system. It presents bound fractions versus halo mass and merger-time distributions; these outputs depend on the adopted mass and unobserved three-dimensional orbital parameters.

Deep X-ray View of a Distant Protocluster Anchored by a Quasar at $z=6.63$: No Evidence for Enhanced X-ray AGN Activity

Shouyi Wang, Feige Wang, Jinyi Yang et al.

In 865 ks of Chandra imaging, no X-ray AGN is detected among 21 confirmed non-quasar members of the z=6.63 J0910−0414 protocluster. The resulting limits do not establish environmental enhancement, but still allow substantial excess activity.

What changes The authors characterize this as the first systematic X-ray AGN census of member galaxies in a z>6 protocluster. Rather than interpreting a null detection solely as a low AGN fraction, they normalize the field XLF prediction by the observed galaxy overdensity and limit any further enhancement of detectable, Compton-thin AGN to ηrel<17.5 (one-sided 90%). Thus the measurement finds no significant excess, but is not yet restrictive enough to exclude an order-of-magnitude-scale environmental enhancement.

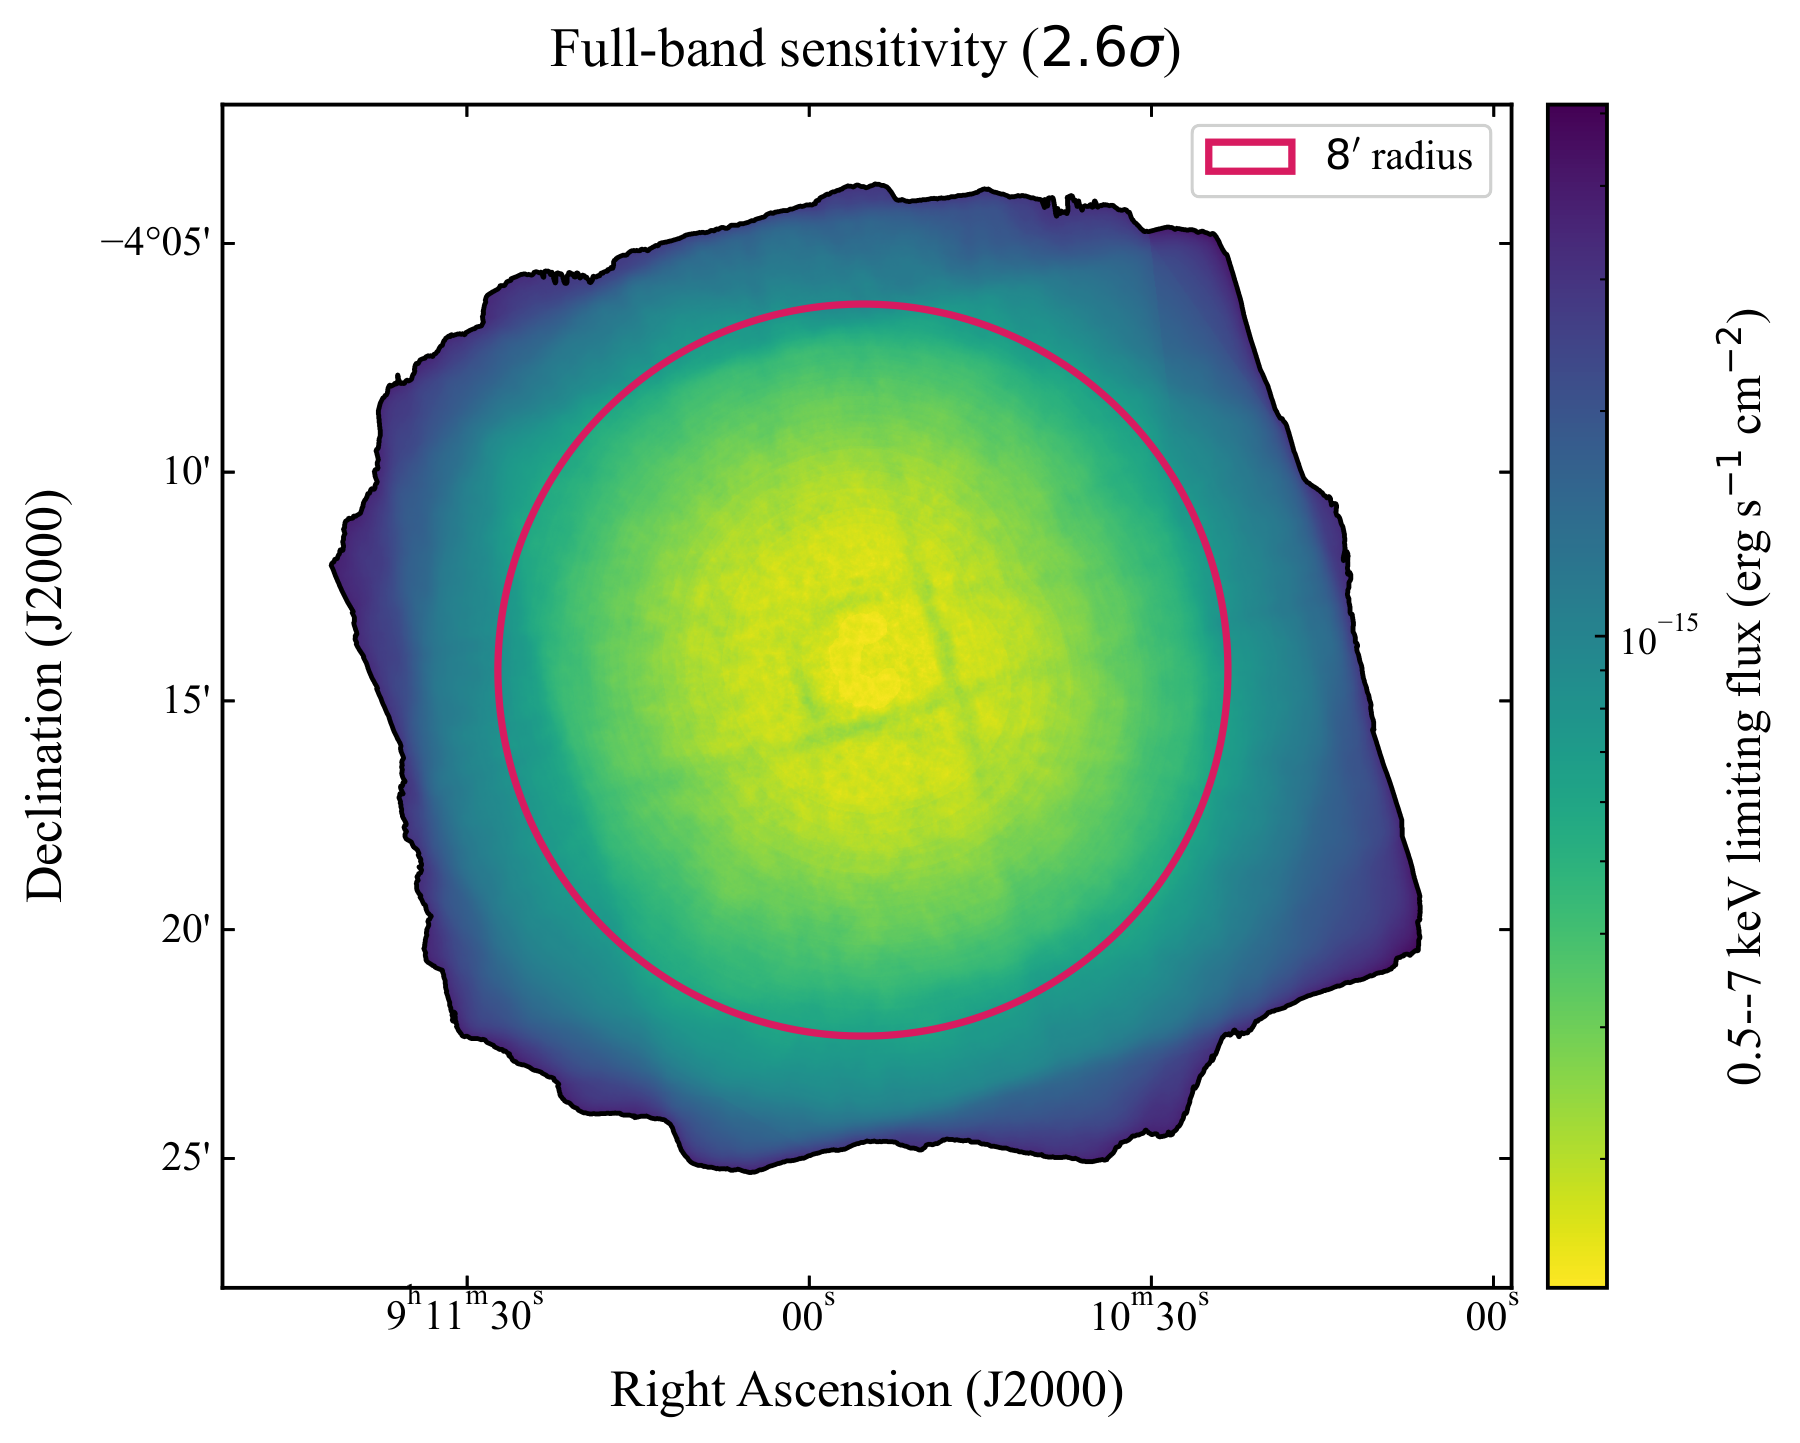
Figure 3 from Deep X-ray View of a Distant Protocluster Anchored by a Quasar at $z=6.63$: No Evidence for Enhanced X-ray AGN ActivityFigure 3 · Open paper
Figure notes (3)
  • Figure 3. Tests the spatially varying full-band flux sensitivity and sky coverage that must be incorporated when turning zero companion detections into AGN constraints.
  • Figure 6. Places the J0910−0414 90% upper bound on X-ray AGN fraction beside published protocluster values. It is descriptive rather than a matched comparison because selections and sensitivities differ.
  • Figure 7. Tests the null result against field-XLF expectations after the sensitivity map and, separately, the galaxy-overdensity scaling are applied; it shows 0.0356 and 0.131 expected AGN, respectively.

How Little Red Dots Turn Blue: Evolution of Kelvin-Helmholtz Contracting Black Hole Envelopes and Observational Diagnostics

Zihao Wang, Kohei Inayoshi

A time-dependent black-hole-envelope model proposes that little red dots become little blue dots as declining inflow permits Kelvin–Helmholtz contraction. It predicts a distinctive UV–optical color excursion and a 5–50 Myr transition, testable with transitional-source demographics.

What changes The central proposed diagnostic is a trajectory in the (βUV, βopt) plane: models make a red excursion near (2, −1) before entering the LBD region. The authors state that its shape changes little over explored feedback and envelope-retention parameters, although those parameters alter timing. They further predict BH growth from roughly 10^6 M⊙ at maximum LRD-phase mass to roughly 10^6.5 M⊙ by the end of transition for intermediate feedback, a factor ~3–5; this is model-dependent rather than a measured offset.

Figure notes (3)
  • Figure 2. Tests the thermal mechanism: cooling-only and accreting models show whether envelope build-up can reach a Hayashi-like 3,000–8,000 K state and whether later depletion reverses the temperature trend.
  • Figure 7. Tests SED-level correspondence by comparing temperature-binned, normalized model spectra (including 16th–84th-percentile ranges) with an extreme-LRD stack, candidate transitional BBQSORS, and LBD GS-3073.
  • Figure 8. Tests the proposed observable color diagnostic against published z>2 NIRSpec sources and broad-line emitters, while showing uncertainties from the LBD spectral prescription.

Large-scale Environmental Dependence of AGN Activity Revealed by JWST Pa$α$ Emitters

Danyang Jiang, Linhua Jiang, Shuqi Fu et al.

Using JWST Paα spectroscopy, the authors find that radio-bright AGNs at z=1.1–1.5 occupy denser ∼1.5 pMpc environments than matched controls; density also correlates with accretion indicators, while environmental Paα luminosity functions are elevated and flatter at the faint end.

What changes The key advance is a comparatively complete spectroscopic census of star-forming environmental tracers at cosmic noon, enabling Mpc-scale density estimates without relying primarily on photometric redshifts or bright-galaxy-limited spectroscopy. Beyond density contrasts, the paper jointly examines radio output, Eddington ratio, black-hole mass, and the Paα luminosity function around AGNs. The authors interpret the combined correlations as consistent with cold-gas-rich large-scale environments promoting black-hole growth and altering galaxy evolution, but present this as a supported scenario rather than a direct gas measurement.

Figure notes (3)
  • Figure 1. Tests the construction and physical scale of the environment estimator: it maps Paα emitters and AGNs, then illustrates the velocity-selected (|Δv|≤2000 km s−1) eighth-neighbor region around an AGN.
  • Figure 2. Tests whether AGN density distributions differ from mass- and SFR-matched controls, separately for radio-bright, radio-faint, and full samples; the 100-control scatter is shown as a 1σ band.
  • Figure 5. Tests whether the Paα-emitter luminosity function changes between field, all-AGN, and radio-bright-AGN environments, displaying binned measurements and fitted 1σ LF uncertainty regions.

Anisotropic Radiation in Super-Eddington Active Galactic Nuclei: The Responsivity of Broad-Line Regions to Continuum Variability

Feng-Na Fang, Pu Du, Jian-Min Wang

Using 175 reverberation-mapping light curves from 128 AGNs, the authors infer that BLR-facing ionizing flux increasingly diverges from the observer-inferred isotropic flux at super-Eddington accretion rates, consistent with—but not uniquely proving—disk-radiation anisotropy.

What changes The new element is the conversion of delay-corrected Hβ variability response into an estimate of the ionizing flux received by BLR gas, followed by comparison to the flux inferred along our sightline under isotropy. The authors test both a single-cloud interpretation and, in the figure set, LOC-based alternatives; they also show scenarios with solar/classic-SED and 5Z⊙/super-Eddington-SED CLOUDY assumptions. This makes the proposed anisotropy test more physically targeted than comparing lags alone, but it remains model-mediated.

Figure notes (3)
  • Figure 1. Tests the observational responsivity measurement: continuum points are shifted by the Hβ lag, poorly bridged temporal gaps are excluded, and the aligned Hβ–continuum flux relation is linearly regressed.
  • Figure 4. Tests the central object-level comparison between the responsivity-inferred BLR photon-flux range and the isotropic line-of-sight estimate, contrasting a sub-Eddington object with a super-Eddington object and displaying measurement-uncertainty shading.
  • Figure 6. Tests whether the flux offset Δlog ΦH covaries with black-hole mass, accretion rate, or Fe II strength, using Pearson statistics and linear regressions under the single-cloud approximation.

The Population of Type~1 Active Galactic Nuclei in Dark Energy Spectroscopic Instrument. I. Profile-dependent Measurements of the Low-redshift Sample

Zhu-Heng Yao, Wei-Jian Guo, Shuo Zhai et al.

DESI DR1 analysis of 114,754 z≤0.9 type 1 AGNs shows that broad-Balmer profile choice systematically shifts Hβ widths, virial masses, accretion rates, and narrow-line diagnostics, while preserving an apparent continuous NLS1-to-broader-line accretion sequence.

What changes The paper’s central contribution is a same-sample, profile-dependent measurement experiment at substantially larger low-redshift scale: it propagates the broad-line functional form through line widths, virial quantities, BPT-style ratios, and accretion-sequence correlations. Despite profile-dependent amplitudes, both prescriptions recover stronger optical Fe II at higher inferred accretion rate (rs=0.667 Lorentzian; 0.614 Gaussian). The authors interpret NLS1s as the high-accretion end of a continuous sequence, rather than a separate population.

Figure notes (3)
  • Figure 1. Tests the construction pathway and selection boundaries: DR1 QSO-classified spectra undergo quality, z≤0.9, and SNR>2 cuts, Hβ–[O III] decomposition, then ML-assisted review. It also separates the profile-dependent NLS1 subdivision from the initial type 1 selection.
  • Figure 6. Tests how the broad-Hβ profile changes distributions of fitted line properties and derived quantities. It compares Lorentzian and Gaussian outputs for FWHM, luminosities, Fe II strength, virial mass, accretion rate, and fit quality, with paired-bootstrap-calibrated KS comparisons.
  • Figure 12. Tests whether narrow-line excitation, represented by [O III] λ5007/narrow Hβ, tracks inferred accretion rate and whether that relation survives the two broad-line models. The reported anticorrelation is appreciably stronger for Gaussian broad-Hβ fits.

A dust-reddened quasar in a [C II]-luminous host at z=6.55

Daming Yang, Joseph F. Hennawi, Rychard Bouwens et al.

JWST and ALMA characterize J1440+0019 as a moderately dust-reddened, rapidly accreting z=6.5488 quasar embedded in a dust-rich, exceptionally [C II]-luminous host; absorption indicates a likely ionized nuclear outflow, but host kinematics remain poorly resolved.

What changes Rather than treating nuclear reddening and host properties separately, this work obtains both for one z=6.55 source: a direct extinction-law test from NIRSpec, a Mg II-based black-hole estimate, and ALMA [C II], continuum, and dynamical-mass inferences. The resulting combination—moderate reddening, λEdd≈0.8, and a luminous dusty host—extends observational characterization beyond UV-selected z>6 quasars, which the authors note dominate the known population.

Figure 1 from A dust-reddened quasar in a [C II]-luminous host at z=6.55Figure 1 · Open paper
Figure notes (3)
  • Figure 1. Tests whether the NIRSpec continuum is consistent with a reddened type-1 quasar template and displays the broad-line and blueshifted-absorption regions used to identify reddening and associated absorption.
  • Figure 4. Tests the spatial and kinematic information available from ALMA [C II] and continuum maps, including the Gaussian line fit and position–velocity diagram; the caption emphasizes that beam-scale emission limits kinematic interpretation.
  • Figure 6. Places the Mg II-based black-hole estimate against luminosity and compares MBH with [C II]-based dynamical-mass estimates, testing consistency with high-redshift blue-quasar loci and, only as reference, the local black-hole–bulge relation.